Why Biotech Sector ETF (IBB) May Turn Bullish In 2025
One of the big themes we see emerging into 2025 is an expansion in Biotechnology and a bullish backdrop for certain biotechnology stocks.
While the...
2025 Stock Market Outlook: Bulls Try For 3 In A Row
Equities were riding high in November, thanks to the post-election rally following Donald Trump’s win and a decent earnings season. What was more encouraging...
Bond Yields Oversold; Will Interest Rates Rise Again?
The Federal Reserve is talking dovish and finally the bond market is listening...
but this may be a trap.
With inflation looking sticky and bond yields...
Long Bonds TLT: Agony and Ecstasy
Today, the Chairman of the Federal Reserve, Jerome Powell spoke.
Here are some highlights:
U.S. BUDGET IS ON AN UNSUSTAINABLE PATH; REVENUE AND SPENDING NEED TO...
German DAX Stock Market Signals Bullish Phase
The DAX is a stock market index consisting of the 40 major German blue-chip companies trading on the Frankfurt Stock Exchange.
The German economy, hit...
Novo-Nordisk Stock (NVO), An Investors Love Story
Novo Nordisk (NYSE:NVO), the company behind Ozempic and Wegovy, is now Europe's largest company as global demand for its drugs have soared.
However, the Danish pharmaceutical...
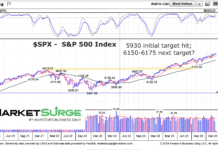
S&P 500 Rally Nears Major Price Target at 6150
The S&P 500 has been pushing higher into year end.
In fact, the rally has taken the index above 6000, which means that the S&P...
Will Black Friday Buyers Lift Stock Market, Bitcoin To New Highs?
The stock market heads into the holiday weekend looking to pick up some momentum into December. Meanwhile, bitcoin is nearing 100,000. Market bulls are...
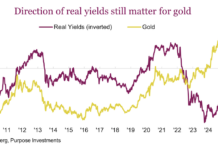
Has the Gold Price Rally Lost Its Luster?
Gold retreated following the U.S. election as money parked in the precious metal in case of trouble or a contested election, moved back out....
Rivian Stock (RIVN) Reverses Higher; Will Buyers Follow Lead?
I have a few central themes for 2025. Yesterday we discussed one of them: vanity stocks. Today we discuss another one: Electric Vehicles and...

