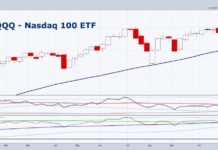
Will the Nasdaq 100 (QQQ) Sell Off in January 2025?
In today’s video, we explore potential scenarios for the Nasdaq 100 ETF (NASDAQ:QQQ) through January 2025. While seasonal strength often boosts year-end performance, results...
Will Federal Reserve Decision Be Naughty Or Nice?
While the NASDAQ 100 (NASDAQ:QQQ) and many of the Magnificent 7 stocks went on to make new highs, the S&P 500 Equal Weight ETF...
Will 2025 Be Bullish For International Equities?
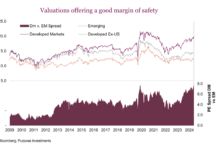
International equities have posted some excellent returns in 2024. But with such U.S. dominance, do many people know?
The allocation decision for many investors to...
Why Investors Should Watch AbbVie Inc (ABBV)
AbbVie Inc is a global biopharmaceutical company that specializes in the discovery, development, manufacturing, and marketing of advanced medicines.
AbbVie focuses primarily on immunology, oncology, neuroscience, and virology treatments, and...
Gold Price Run-Up Gives Way To Consolidation
It's been a stellar year for gold and silver and the precious metals sector.
After breaking out over $2200, gold surged to $2800+ and was/is...
NASDAQ Remains Strong; Should Investors Buy The Dip?
In a recent analysis of the current stock market, I stated:
“But, unless the market continues to broaden, we can almost take the Mag 7...
S&P 500 Index Update: Sideways Price Consolidation Unfolding?
The S&P 500 has shown a loss of upside momentum with its last rally higher off the early November low.
There is still no sign...
Is the Nasdaq Rally For Real? Watch for Market Broadening!
While the Nasdaq 100 made new all-time highs today climbing over 20,000, all the Magnificent 7 stocks and investors cheered!
And as they should. After...
How Will Stock Market Perform Under Trump?
As we embark on a four-year journey with President Trump at the helm of the world’s largest economy, there are both knowns and unknowns.
Given...
Stratasys Stock (SSYS) Higher as 3D Printing Shows Profitability
An Israeli company, Stratasys Ltd., saw share prices for its stock (SSYS) climb after the company raised its earnings outlook for the year and...


