US Stock Market Indices Showing Strength $DJIA $SPX $RUT $COMPQ
For the week ending October 30th, I wrote a post on the state of the 4 major US stock market indices. This post included the Dow...
S&P 500 Weekly Review: Market Seasonality Calls For A Pause
Last week played out exactly how the first week of November would have played out from a seasonality perspective. Quite strong despite the back...
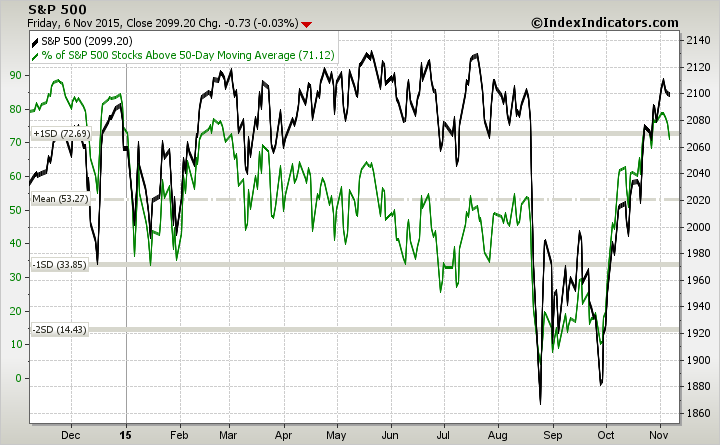
Stock Market Outlook: Breadth Has Some Catching Up To Do
What We Are Watching
This Week's Stock Market Outlook:
Can Small-Caps Get In Gear – The NASDAQ 100 (has made a new high, and the S&P...
Facebook 3Q Earnings Expectations High As Stock Pushes Higher
Facebook (FB) will announce 3rd Quarter earnings after the close today. Will Facebook earnings bring about a big move higher like fellow large caps...
Intel Stock Price Outlook (INTC): Overbought But Bullish
Just a four months ago, I provided an update on Intel stock (INTC) that included some lower INTC price targets where bulls could look...
Are Stocks Set To Reverse Course? Watch Those Open Gaps
Many investors may not like to hear this, but I think the market will retreat. Why do I say this and with what guarantee?
The...
US Stock Market Indices: Must Watch Levels In November
All the major U.S. stock market indices are at important levels right now. From the Dow Jones Industrial Average to the NASDAQ to the...
WTI Crude Oil ETF (USO): Why Higher Prices Lie Ahead
We are revisiting the crude oil market this week, because there probably are some trades nearby in the popular United States Oil Fund ETF...
How Much Higher Can Starbucks Stock Price Go? (SBUX)
Starbucks stock price has been in rally mode for the past several weeks... months... years. And for good reason. Coffee prices are suppressed and...
Chart Of The Week: Russell 2000 (IWM) Breakout Or Fakeout?
The stock market rally in October has been a beast. It's been relentless. But something is missing.
Several large cap stocks have pushed higher during the...


