Chart Of The Week: Russell 2000 (IWM) Breakout Or Fakeout?
The stock market rally in October has been a beast. It's been relentless. But something is missing.
Several large cap stocks have pushed higher during the...
Will Market Seasonality Push Stocks Past Major Resistance?
This week I put on a webinar during which I shared a number of positive stock market seasonality studies. Taken together, these studies highlight seasonal stock market...
S&P 500 Trading Update: Risk-Reward Shifting To Downside
It's been a nice run higher for stocks over the last month. After retesting the August lows on September 29th, the S&P 500 is...
Currency Outlook: Australian Dollar (FXA) Set To Chop Higher
We often see forex charts moving in opposite directions to the U.S. Dollar, but there may be an exception this autumn for the Australian...
Apple Stock (AAPL): Is It Time To Take A Bite?
Should investors take a bite out of Apple stock (AAPL)? Sorry, I couldn’t help myself. But that is a question that many investors are...
Chart Spotlight: Nasdaq Futures Produce Bearish Signal
It's not every day that I get a really interesting pattern in my scans. But the chart pattern below of the Nasdaq futures was...
Weekly Stock Market Review: Is Some Consolidation In Order?
This past week we saw major stock market resistance levels blown out to the upside. Like many, I expected this rally to stall around...
Apple (AAPL) Earnings: A Catalyst For Next Big Stock Move?
Apple Inc (AAPL) reports earnings on Tuesday 10/27 after the market close (approximately 4:30 pm ET). According to Estimize, Wall Street is expecting AAPL earnings...
The Treasury Bond ETF (TLT) Is Nearing A Big Move
The chart of the iShares 20+ Year Treasury Bond ETF (TLT) continues to confuse many investors. Other than pointing out key support and resistance,...
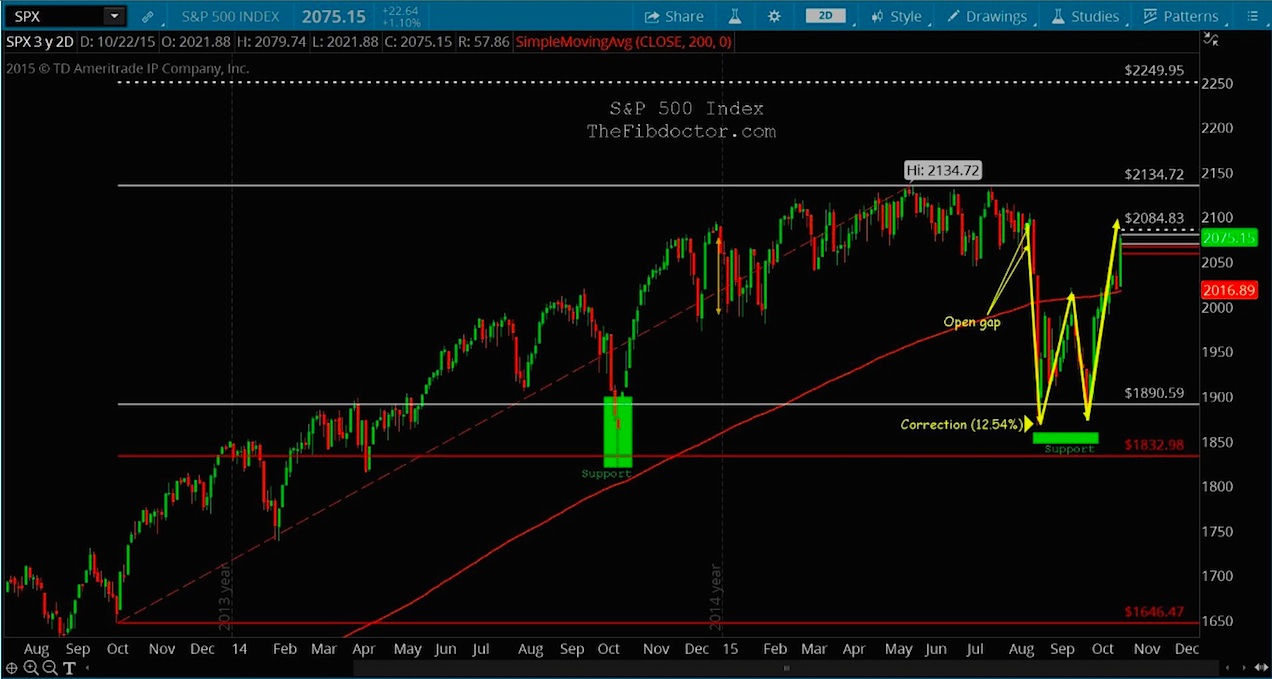
S&P 500 Market Update: Are New Highs On The Way?
The past 3 weeks has seen the S&P 500 Index zoom higher by more than 200 points. The rally has brought the index back...


