S&P 500 Futures Higher: 1931 Holds The Key For Traders
The Morning Report: Markets In Bounce Formations
Earnings season continues. There was more jagged overnight price action in stock market futures last night.
Looking at the...
Point And Figure Chart: S&P 500 Sell Signal Targets 1836
As many of you know I have a deep appreciation for point and figure charting. The main reason I like it so much is...
Stock Market Open Gaps Get Filled: Now What?
In my mind, it’s as simple as ALL futures stock market open gaps eventually get filled. It just takes patience and a system that...
Russell 2000 Update: Small Caps Better Right The Ship Soon
The Russell 2000 got obliterated last week, plunging 8 percent. Since the June 23 all-time high, the small caps index has cratered 19.3%. It's...
Trading Ideas: 4 Stocks To Watch This Week
The stock market is off to a brutal start in 2016. The tricky part now for traders is trying to figure out how oversold...
Is The Russell 2000 Index Entering A Bear Market?
Back in May of 2015, I wrote a piece on the Russell 2000 Index highlighting 2 critical price support levels of 1221.44 and 1213.55. In that...
Twitter (TWTR) Hits New Lows: Stock Oversold But Heavy
Shares of Twitter (TWTR) broke the $20 level on the downside and declined as low as 19.60 before recovering some of the day's losses....
Key Market Breadth Indicator Hits New Lows: An Ominous Sign?
Many market participants and pundits have been discussing how this has been the worst start to a new year for stocks that we’ve ever...
S&P Futures Decline Into Primary Bounce Zone
The futures market is down for the fourth day breaking through important support and holding below 1968.
China’s markets were halted due to a sharp dip...
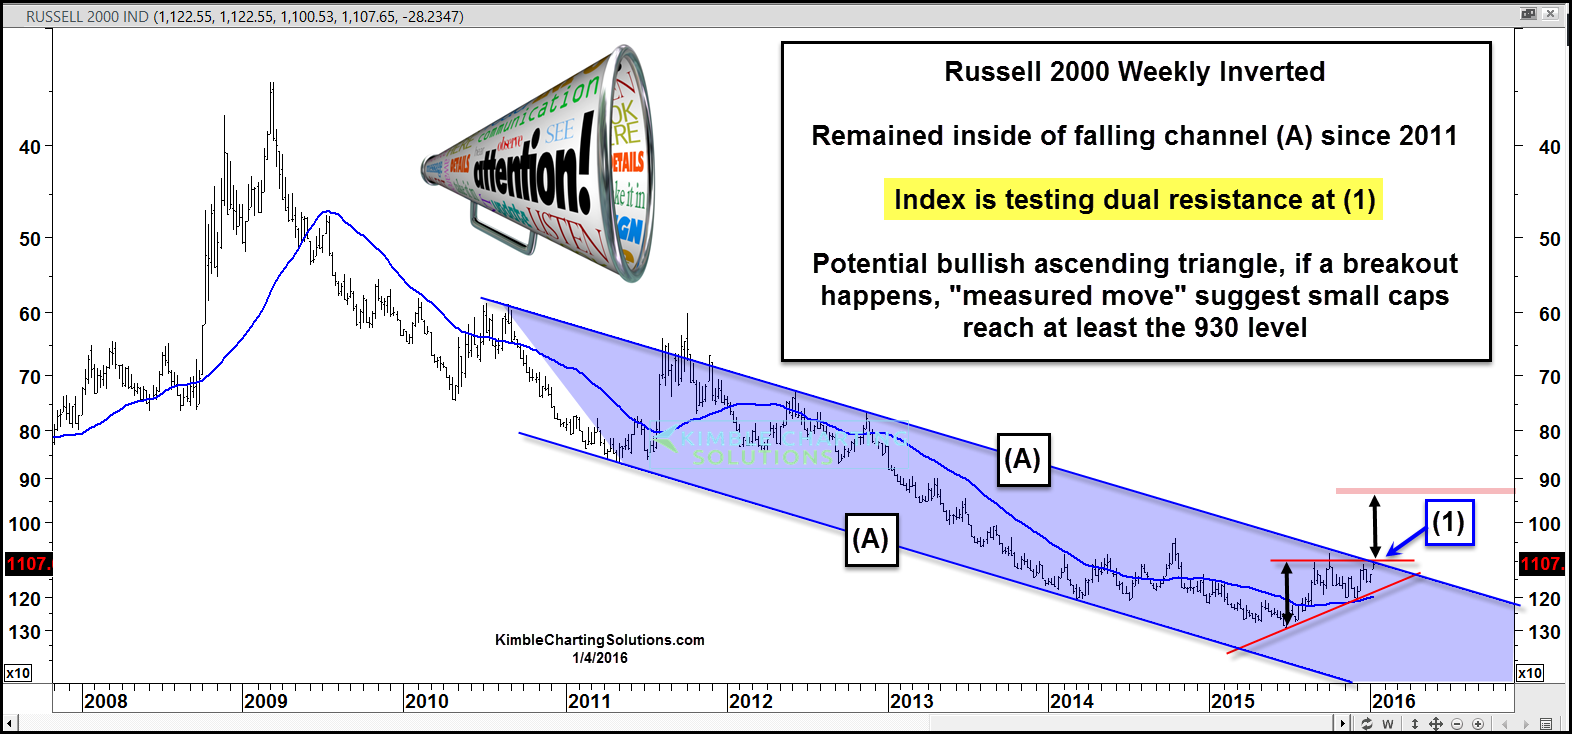
Russell 2000 In Trouble? Inverted Chart Highlights Major Test
The Russell 2000 and small caps stocks spent 2015 largely underperforming their large cap brethren (i.e. the S&P 500). And that has brought the...


