LinkedIn Stock Price Crushed: Is More Downside Likely?
LinkedIn Corp (LNKD) has made a name for itself in corporate networking and has a product that many professionals use. However, investors crave growth...
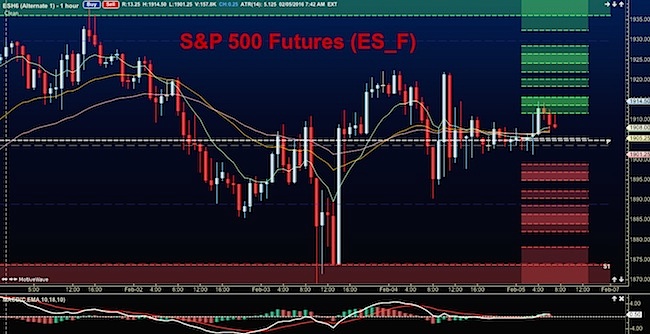
Stock Market Futures Push Higher; Traders Await Yellen
A positive divergence eventually showed up in price action overnight as stock market futures jumped higher.
The S&P 500 futures rose into resistance levels around...
S&P 500 Futures Trading In Jagged Range: Decision Time
S&P 500 futures trading in a jagged range. On Monday, S&P 500 futures drifted into deeper support again before bouncing off a key level...
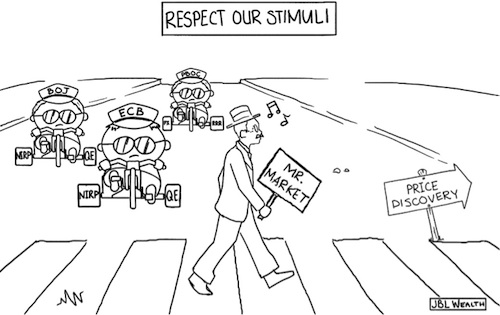
Central Banks To The World: Respect Our Stimuli!
January may go down as the month Mr. Market refused to “Respect Our Stimuli” and started the stroll towards price discovery. Efforts by the...
Stock Market Futures Lower In Downside Continuation
Stock market futures are trading sharply lower this morning. A cascade of selling on Friday continued after the break of the 1902 contested levels....
Stock Market Bears Driving Deep into Bulls Territory
Once again, the bears have the ball, 1st and goal from the 1 yard line. And, yes, we've seen this quite a bit in recent...
This Isn’t The Stock Market You Imagined: Welcome To 2016
As they say, history often rhymes... But it rarely repeats. Or at least in the way that we imagine.
That's not to say that looking...
S&P 500 Futures Clinging To Key Support; Battle Lines Drawn
Yesterday was an aggressive day of range-bound trading that left traders battling at lines of major congestion between 1902 – 1907 on S&P 500 futures.
With...
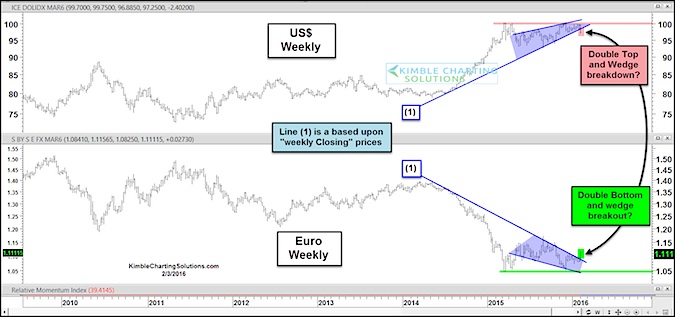
Euro Currency Breakout Has Major Implications For Markets
For much of the past several months, the Euro has been trading in the gutter. It was written off for dead and King Dollar...
Russell 2000 ETF (IWM) Should Resume Decline Soon
As the stock indices have become more volatile in recent weeks, we have been updating our charts and targets. This post offers a quick...


