American Airlines Stock (AAL): Out Of Gas Or Ready To Fly?
Despite topping Q1 EPS estimates and authorizing a $2B share repurchase program, investors in American Airlines stock (AAL) haven't been impressed by the company's...
5 Trading Ideas For Bulls ($RTN, $CHKP, $MDT, $UPS, $BTCUSD)
At the end of every trading month I like to scan through monthly charts to gain some context about the general health of the market...
Apple (AAPL) Elliott Wave Pattern Looks Much Lower
The pending decline in shares of Apple Inc. (AAPL) could be almost as impressive as its meteoric rise from 2009. While the stock far...
3 Reasons To Watch The Dollar Here: Gold, Oil, And The Euro
What a year! And it's only the beginning of May. Over the past couple of months, if you have been participating in the reversion...
S&P 500 Futures Rise As Stocks Catch A Bid
Stock Market Outlook for May 2, 2016 – A look at the monthly chart for S&P 500 futures (ES_F) still shows bullish weight with...
Apple Stock Update: Here’s The Bullish AAPL Buy Setup
We’ve been tracking Apple ($AAPL) since February 2015. At the time, I shared some ending price targets for the major wave it was in....
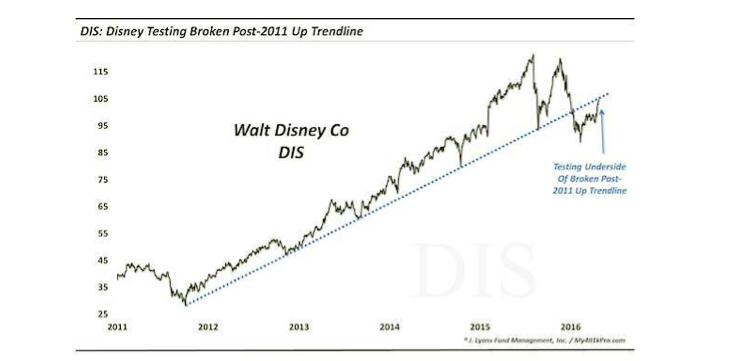
Will The Rally In Disney Stock (DIS) Be Frozen Here?
The recent rally in shares of Disney stock (DIS) has been good for investors and traders alike. But will the momentum be enough to...
S&P 500 Futures Chart: Time To Test Lower Support Levels?
For the past several days, I have been talking about the range we've been in. During the past few weeks, the S&P 500 futures...
Aussie Dollar Strength Key For Commodities; At Major Resistance
After a steep decline across the commodities sector, the recent rally has breathed life into the sector. To be clear, the rally has been...
S&P 500 Futures Decline On Bank Of Japan Surprise
Stock market outlook for April 28 – The Bank of Japan surprised the markets dramatically by not making further moves to increase stimulus. The...


