Charting A Topping Pattern On The Russell 2000 ETF (IWM)
September has presented traders with several warning signs of instability in equity and bond markets. So we are focusing our posts and our newsletter...
S&P 500 Futures Trading Outlook For September 28
Stock Market Futures Outlook for September 28, 2016 –
After the initial fade into the morning yesterday, the S&P 500 (INDEXSP:.INX) lifted off the lows....
S&P 500 Trading Chart: Can The Rally Surpass Key Resistance?
As I'm writing, major stock market indices are reversing back higher. Below is a chart highlighting some key price levels for S&P 500 Futures....
S&P 500 Futures Trading Outlook For September 27
Stock Market Futures Outlook for September 27, 2016 - After the Presidential debate last night, we still remain landlocked, though the charts did show quite a...
Can The Precious Metals & Mining ETF (XME) Hold Its Breakout?
It's no secret that one of the biggest laggards within the equity market over the past 5 years has been the precious metals &...
Gold And Silver Update: Are Bulls On The Verge?
One of the themes of 2016 has been the revival of Gold prices (NYSEARCA:GLD). After reaching new multi-year lows in late 2015, Gold has regained...
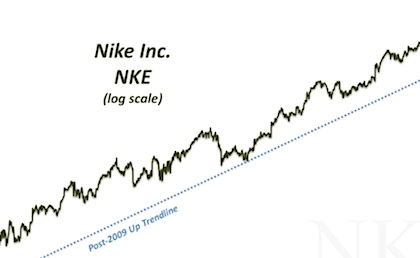
Nike Stock Chart (NKE): 7 Year Trend Line Getting Tested
One of the steadier stocks, and companies, in the U.S. stock market over the last half decade has been Nike (NYSE:NKE). It is currently...
Major Commodity Index Has Rallied Back To A Pivotal Level!
Select commodities have done well this year, especially those in the Energy and Precious Metals space. These heavyweights have done enough to push the...
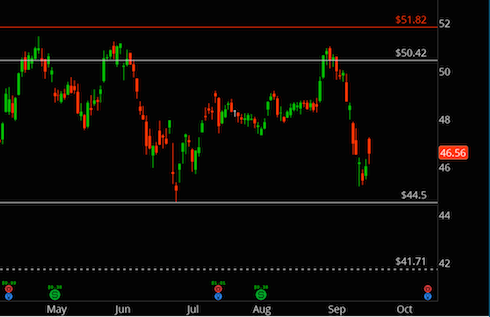
Wells Fargo’s Stock (WFC) Declines: Downside Price Targets
Wells Fargo's stock price (NYSE:WFC) has spent much of 2016 trading between $44 and $51 per share. But that range could get broken to...
Treasury Bonds ETF (TLT) On Verge Of Turning Bearish
In our June post about treasury bond futures and the related iShares Barclays 20+ Year Treasury Bonds ETF (NASDAQ:TLT), we suggested that both were...


