All About Tesla’s Musk-Tique
This morning, I made my debut on CNBC’s show Worldwide Exchange with Frank Holland.
Here are the notes I prepared.
At the start of 2024, the...
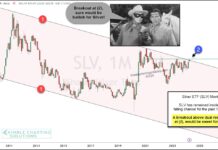
Silver Looks Ready For a Major Breakout!
Silver has been quietly building a bullish case for a trading breakout.
The Silver ETF (SLV) has been coiling just beneath major breakout resistance. And...
Bond Yields and US Dollar Head Higher, Junk Bonds Tumble
As we start a new month, quarter, and week, I want to remind you how I concluded the weekend Daily:
“Narratives are not very meaningful...
Retail Sector ETF (XRT): Next Breakout Targets $90
Retail stocks are showing some strength as they come into an important breakout price resistance zone.
The Retail Sector ETF (XRT) is currently trading at...
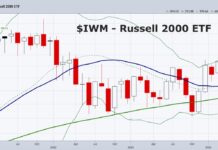
Key Stock Market ETFs Finish Q1 With Strength
The last time the Russell 2000 IWM closed out a month above the Bollinger Band we like to use, was in March 2021.
So, there...
Materials Sector (XLB) Rally Reaches Trading Price Target
Most materials and hard commodities related stocks have performed well lately.
Today we look at the S&P Materials Sector ETF (XLB) to highlight the rally......
Small Cap Stocks Testing Important Breakout Resistance
Stocks continue to show strength into 2024. And one index that has been a laggard appears to be perking up.
The small cap Russell 2000.
When...
Is the Gold Miners ETF (GDX) Ready To Blast Off Higher?
Just as everyone is fawning over Bitcoin and stocks at all-time highs, Gold has quietly made all-time highs. And, just as we wrote earlier...
Nvidia’s Stock Reaches Crossroads At Key Fibonacci Price Level
Nvidia has been a lightning rod of attention as it surged to parabolic highs over the past several weeks.
This surge also helped lead semiconductors...
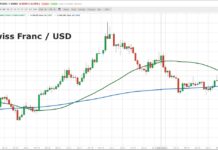
Swiss-Franc Currency Decline Nears Important Pivot Support!
I imagine that you, like me, look forward to reading about the markets that are rarely covered.
For example, yesterday we looked at Truth Social...


