Is the Nasdaq 100 Repeating Bearish Topping Pattern?
Large cap technology stocks carry a significant amount of influence on the Nasdaq 100 and broader stock market indices.
Not only do many popular tech...
Oil Prices Poised To Head Lower Into 2025 (Elliott wave analysis)
Crude oil prices have remained in a relatively narrow range for the past year, but we think the oil market offers the potential for...
Are High Yield Spreads Forecasting Another Stock Market Collapse?
There are a lot of indicators to follow when trying to project future stock market performance.
But today we look at an indicator that has...
Gold Miners (GDX) Near Larger Selloff? Investor Opportunity!
The surge in gold prices in 2024 has seen gold breakout to new all-time highs and gold mining stocks out-perform.
More precisely, the Gold Miners...
Post Election Risks? Watch These Semiconductor and Railroad Stocks
AI enthusiasm remains high, but macro uncertainty could be rising in the semiconductor space
As earnings season chugs along, we profile NXP Semiconductor, CSX, and...
Bitcoin ETF (IBIT) Triggers Bullish Buy Signal With Higher Price Target
After a prolonged consolidation, Bitcoin has re-asserted its market leadership this week.
The crypto king has broken out of a flag-like consolidation pattern and looking...
Will Bearish Pattern Take Semiconductors (and the Stock Market) Lower?
Over the course of the 15 year bull market, investors have seen important pockets of leadership emerge.
And, as we have highlighted several times, leadership...
Who’s Right: The 10-Year Bond Yield or The FED?
The Federal Reserve met 6 weeks ago to make a decision on the key interest rate. 25 basis points was a gimme with 50...
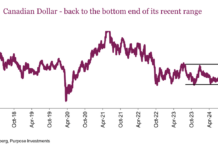
The U.S. Dollar, Loonie and the Hedge Conundrum
Summary: The U.S. Dollar (USD) has risen a lot lately against most currencies including the Canadian Dollar (CAD). There are many economic/yield reasons for...
Dow Jones Utilities Rally At Resistance; Pullback Next?
Utilities stocks have been surging higher this year.
Once thought of as a conservative hedge-like allocation for investors, Utilities have been performing like tech...


