Gold / US Dollar Price Ratio Making Historic Move!
The price of Gold has been moving steadily higher over the past year, making new all-time highs. It's currently trading over $2500!
And we have...
Yen / US Treasury Bonds Correlation High: Next Move Important!
When treasury bonds are rising, interest rates are falling. And typically this is a sign of bonds being a safe haven.
Recent action in the...
Barrick Gold Stock Price Building Strong Base
The price of gold has been on a tremendous run higher 2024, most notably passing the $2500 price per ounce.
The rise in gold prices...
Japanese Yen Sizzles and Fizzles: Watch the August Close!
We discussed the prospect for a low on the Japanese Yen currency several weeks ago.
Here is the link to that article. And...
Did Warren Buffett and Retail Stocks Save the Equities Market?
Yesterday we tried to make it easy for you.
The Retail Sector ETF (XRT) told us a lot after the economic data already out earlier...
The Stock Market’s Next Move Comes Down to These Key Sectors
Let’s make this real easy.
After inflation data, speculation on the next moves from the FED, fears of recession, calls for soft landing and so...
When the Stock Market Exhibits a Lack of Clarity, That’s Clarity
Here are my most recent overall thoughts:
We are exercising caution as the growth stocks and SPY are in warning phases, well below their July calendar...
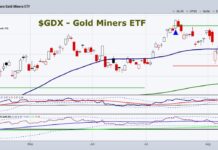
Gold Miners (GDX) Rally As Gold Trades Over $2500 per Ounce
Hedge funds are the most bearish on commodities prices in at least 13 years as fears of a deeper economic slowdown cast doubts on...
Stock Market Weekly Update: What Are Key ETFs Telling Investors?
Did this past week really resolve which way the Modern Family wants to go from here?
In some ways yes and other ways no.
Yes
All are...
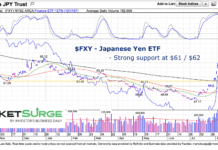
Japanese Yen (FXY) Breakout Creates Bullish Formation
The past couple weeks have seen the Japanese Yen currency form a bullish reversal from extreme trading lows.
The rally higher has put the currency...


