Semiconductor Stocks Trading At Critical Inflection Point!
Over the past two decades, it's fair to say that semiconductor stocks have been an important part of the technology space.
This is true from...
Can Stock Market Hold Up Amidst Soaring Commodities?
Last week the major indices made a successful rally back into a short-term support area. However, many see the price move as a rally back...
Regional Banking ETF (KRE) Confirmed Bullish Phase Change
The Regional Banking ETF (KRE) has made two consecutive closes over its 50-Day moving average confirming a bullish phase change.
KRE is also the only...
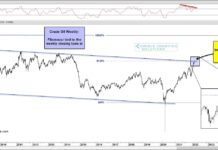
Crude Oil Prices See Volatility At 61.8% Fibonacci Resistance!
The geopolitical scene across the globe is gathering intensity as western countries and leaders clamp down on Russia for sending troops into Ukraine.
This has...
Nintendo Stock Consolidating After Building Massive “Cup” Base
Gaming has been a hot sector for the past decade plus. And each of the gaming console stocks tends to go through cycles and...
Question the Crowd and Look For Market Hints
At the beginning of the week, investors worried as the market sold off.
Then Thursday, the major indices made a large gap lower igniting many...
Transportation Stocks Running Into Important Resistance
A strong 2-day rally to finish the week has several stock market sectors nearing critical resistance.
One example is the transportation sector (IYT).
The Transports rallied...
Is Major Junk Bonds Divergence a Warning Sign for Stock Market?
Before major market pullbacks, it is common to see internal market disconnections or divergences. And they often go on for much longer than investors...
Commodity Price Index Near Most Overbought Level In 45 Years!
The CRB Commodity Index has rallied sharply over the past 2 years.
And although the index is not near all-time highs, it is getting stretched...
Will S&P 500 Index Correction Hold Key Price Support?
This morning's selling has the major stock market indices well into correction territory (and bear market territory for the Nasdaq and Russell 2000).
Today we...


