Chartology: Unitedhealth (UNH) Backtesting Neckline of Double Top Breakdown
In my July 27th Chartology on Unitedhealth Group (UNH), I mentioned that the stock was oversold and ready for a bounce, possibly to backtest...
Chartology: Emerging Markets (EEM) Continue to Lag
Since early February, the Emerging Markets (EEM) have really lagged the major U.S. indices (here shown against the S&P 500 index fund - SPY). This...
Chartology: Financials (XLF) Low Volume Breakout
By Andrew Nyquist
Although the Financial Select Sector (XLF) has not been overly flashy, it has played a key role in the recent stock market rally. Most...
Chartology: Russell 2000 (IWM) Technical Picture
I've covered the Russell 2000 (IWM) quite a bit on the chartology blog. I think it's important as it gives you a general feel for...
Chartology: McDonald’s (MCD) Clinging to Trend Line
2012 has been a rough year for McDonalds (MCD) stock. Further, when one considers and compares performance metrics to the overall market YTD, its...
Chartology: Exxon Mobil (XOM) Attempting to Break Out
For Exxon Mobil (XOM) stock, "V" stands for volatility and V-shaped moves. The volatility part is due in part to the previous two bouts...
Chartology: Corn Nearing Exhaustion?
After a dramatic 50% move higher due to drought conditions, Corn prices may be ready to take a breather. A close above 796 on...
Chartology: Google (GOOG) Technical Update
Here is an update to last week's chartology pointing out Google's impending thrust higher into a parallel DeMark weekly sell setup count. Hopefully some...
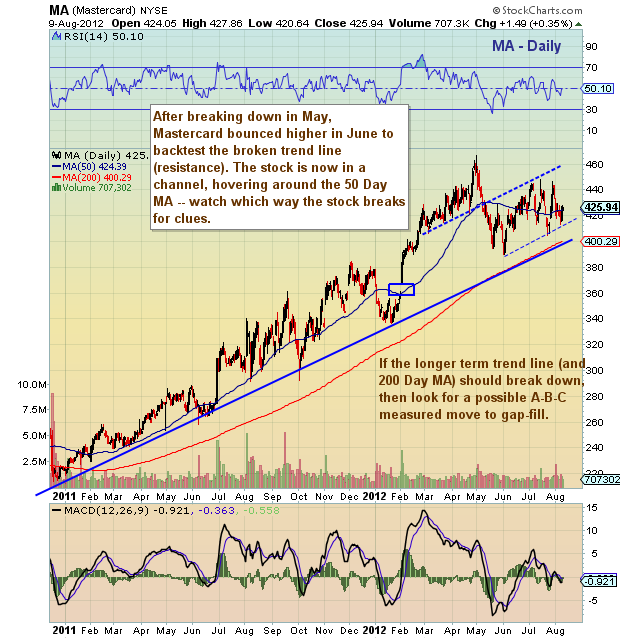
Chartology: Mastercard (MA) Uncertain, Watch Action Around 50 Day MA
For the past week or two, Mastercard (MA) has been hanging around the 50 day moving average. Watch the action here and now. A...
Chartology: Flour (FLR) Nearing Confluence of Resistance
Fluor (FLR) formed a nice rounded bottom during a two month basing process in June and July. The stock then rocketed higher, and is...


