Solar Sector ETF (TAN): Will Price Reversal End Downtrend?
The Solar Sector ETF (TAN) has begun to show up on investment radars once more.
Just weeks ago, solar stocks were left for dead. But...
Crude Oil Likely To Hit $127 After A Brief Pause
After a steep pullback, crude oil prices have reversed higher. I highlighted this bullish reversal in a research note here on See It Market...
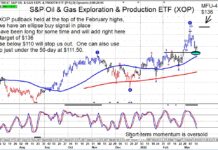
Crude Oil and Energy Stocks, ETF (XOP) Heading Higher
We are not expecting crude oil or energy stocks to rally in a straight line up, but we are off to a good start.
The charts...
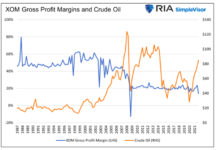
Big Oil and The Fallacy of a Windfall Profits Tax
Higher energy prices worrying you? Be afraid because Congress is coming to the rescue. Legislators are introducing a new bill called the “Big Oil...
Rates Increase and Transportation (IYT) Clears its Major Moving Averages
Wednesday, the market rallied into the Feds rate announcement, showing speculator's optimism given the current downward trend.
It also helped that Monday, the Nasdaq 100...
Will Oil’s Price Decline Offer A Lift To Stock Market?
Oil makes a reversal pattern and rejects its 80-month moving average; however, will the overall trend stay intact, or has Wednesday signified an end...
Could Peak Oil Be Happening Right Now?
Crude oil prices (and everything else) started rising with COVID and supply chain issues. And now that we are adding sanctions on Russia and...
Why Oil & Gas ETF (XOP) Trading Price May Exceed $150
With Oil prices over $120 per barrel, the SPDR Oil & Gas Exploration and Production ETF (XOP) is trading sharply higher.
And it may be...
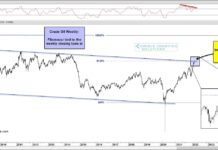
Crude Oil Prices See Volatility At 61.8% Fibonacci Resistance!
The geopolitical scene across the globe is gathering intensity as western countries and leaders clamp down on Russia for sending troops into Ukraine.
This has...
Crude Oil Overbought, Elliott Wave Points To Pullback
It's hard to score profits by trading on news headlines, and the current environment makes it even harder. We prefer to rely mainly on...


