S&P 500 Futures Outlook: Are Bulls Losing Strength?
Broad Stock Market Outlook for March 20, 2018
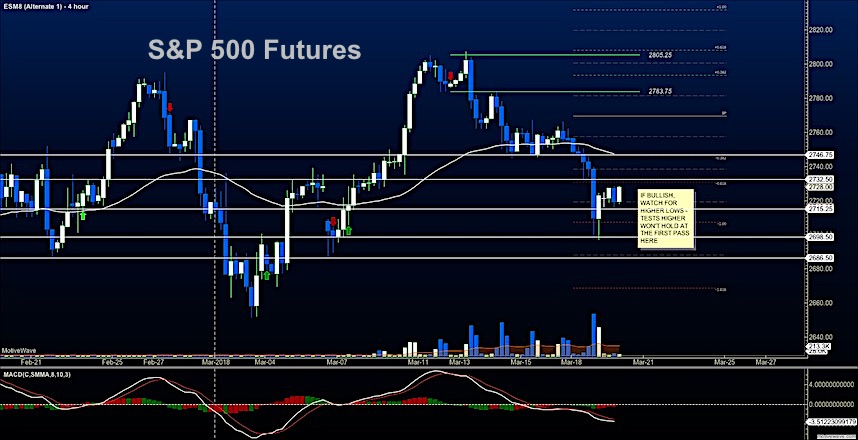
If you had watched the support zones yesterday, you did well with the breakaway short formations that came...
Crude Oil Update: Watch That Up-Trend Line!
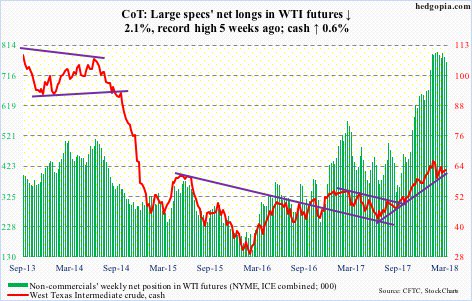
The following chart and data highlight non-commercial commodity futures trading positions as of March 13, 2017.
This data was released with the March 16 COT...
Stock Market Trading Outlook: Bulls Hit The Gas Pedal
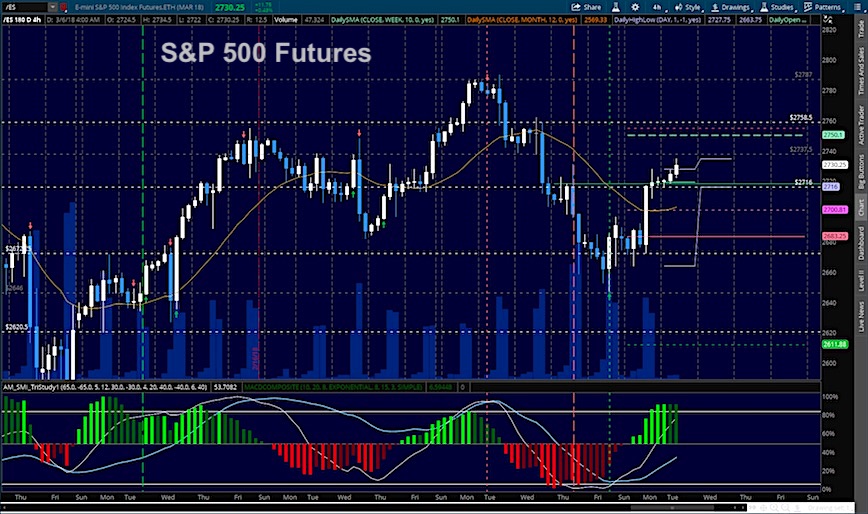
Broad Stock Market Outlook for March 9, 2018
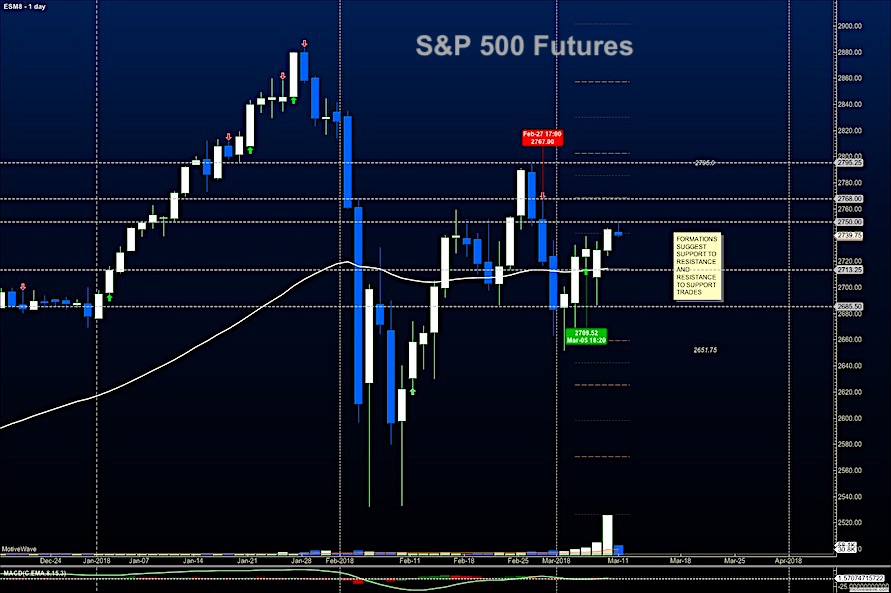
Stocks jumped higher on the jobs report, but have stalled around 2750-2755 resistance. We sit in congested zones...
Stock Market Futures Trading Update: Bulls Look To Recover Losses
Broad Stock Market Outlook for March 7, 2018
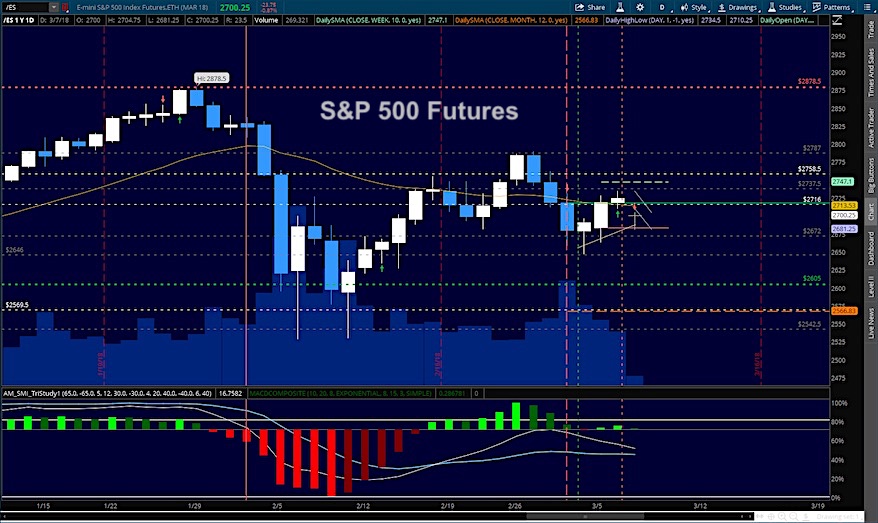
The news about Gary Cohn leaving the Trump administration sent markets gapping down after hours. However, since that...
S&P 500 Futures Trading Update & Near-Term Price Targets
Broad Stock Market Outlook for March 6, 2018
Bounces continue across all the indices this morning and higher lows form as a potential right shoulder builds...
Stock Market Futures Trading Outlook: Under Pressure
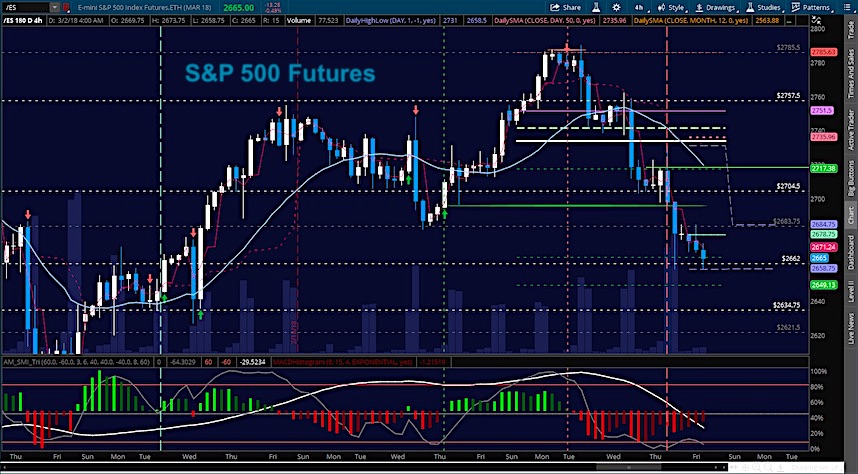
Broad Stock Market Outlook for March 2, 2018
Deeper tests continue across the board as momentum weighs heavy with sellers forcing prices down across the indices.
Today...
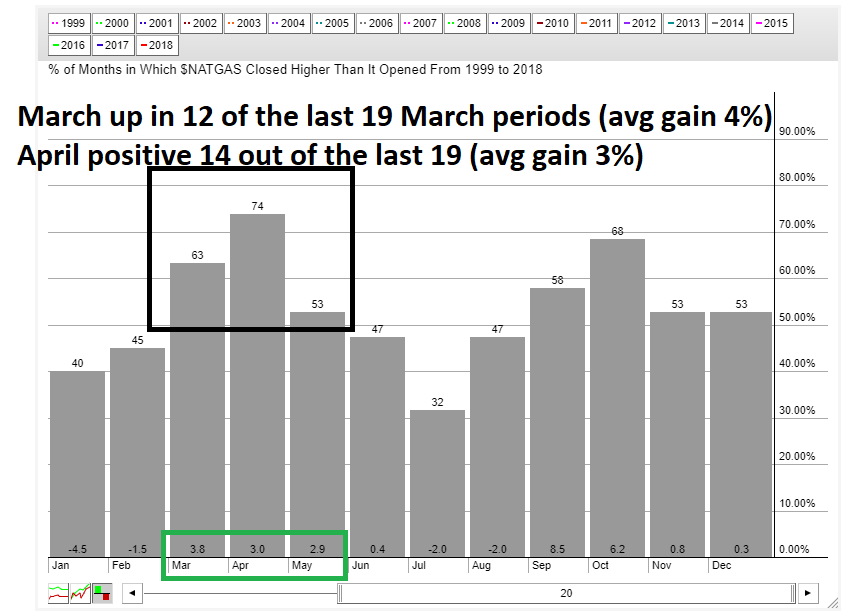
Natural Gas Seasonality Turns Bullish Into Spring Time
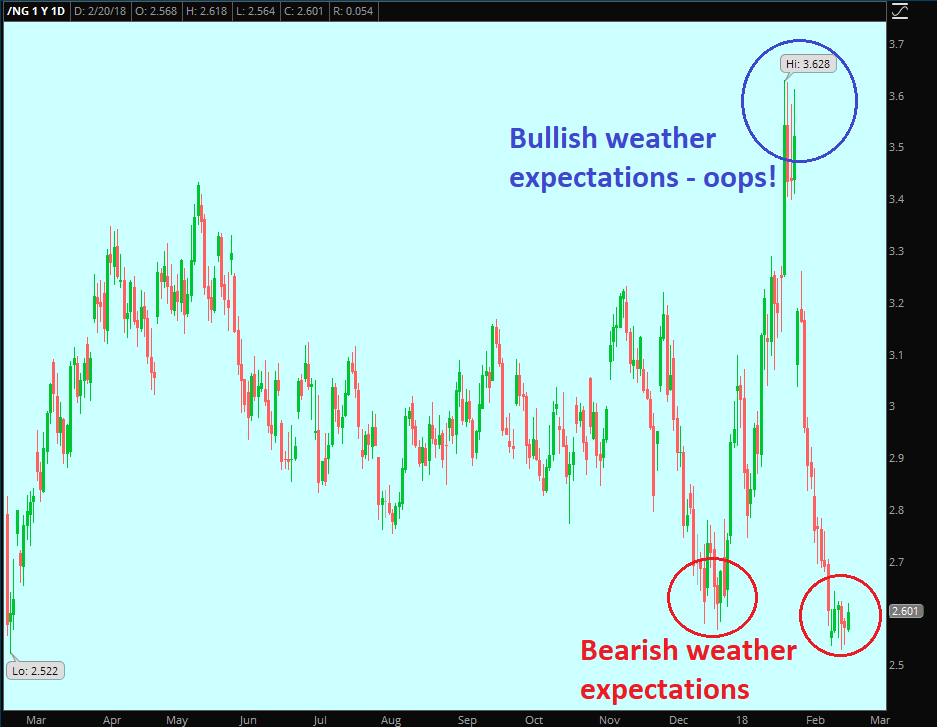
Natural gas prices dropped precipitously from Mid January into this week. I covered that in my article earlier this week.
Today I want to look...
Stock Market Futures Trading Outlook: A Big Break Is Coming
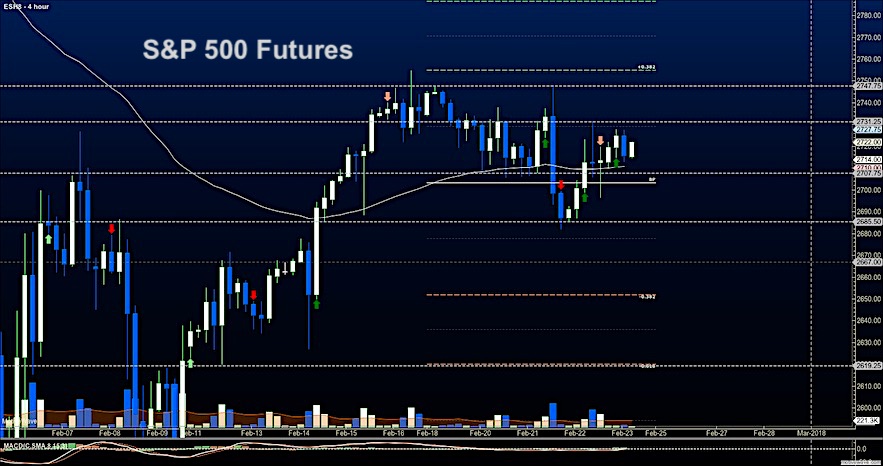
Stock Market Futures Outlook for February 23, 2018
Diminishing directional moves continue as the current price range compresses on the S&P 500. Traders should expect a...
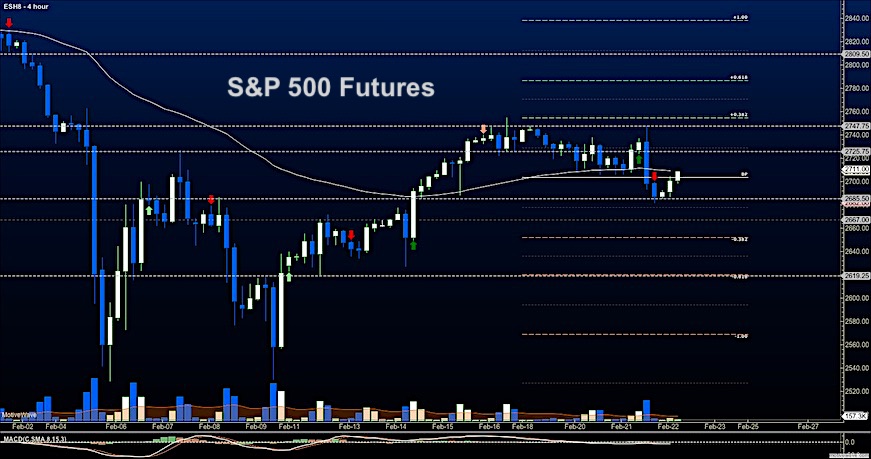
S&P 500 Futures Update & Trading Outlook: Eyes On 2705
Broad Stock Market Outlook for February 22, 2018
Price resistance stood tall yesterday and rejected the bulls advance. This lead to a very swift move to...
Natural Gas Hits Lowest Level Since 2016 as Mild Weather Persists
The March 2018 NYMEX natural gas contract fell $0.022 to close at $2.558/MMBtu on Friday last week.
The March contract for Natural Gas ended the...

