Key Stock Market ETFs Start 2025 With Cautious Patterns
I hope everyone had a wonderful holiday and has a very happy and successful New Year.
I spent time with my family and of course...
Russell 2000 At Important Risk-On vs Risk-Off Crossroads!
The stock market has been charging higher into year end. Then came the FED interest rate decision and comments.
But a even a couple weeks...
Will the Nasdaq 100 (QQQ) Sell Off in January 2025?
In today’s video, we explore potential scenarios for the Nasdaq 100 ETF (NASDAQ:QQQ) through January 2025. While seasonal strength often boosts year-end performance, results...
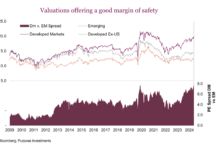
Will 2025 Be Bullish For International Equities?
International equities have posted some excellent returns in 2024. But with such U.S. dominance, do many people know?
The allocation decision for many investors to...
NASDAQ Remains Strong; Should Investors Buy The Dip?
In a recent analysis of the current stock market, I stated:
“But, unless the market continues to broaden, we can almost take the Mag 7...
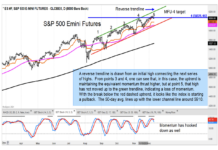
S&P 500 Index Update: Sideways Price Consolidation Unfolding?
The S&P 500 has shown a loss of upside momentum with its last rally higher off the early November low.
There is still no sign...
How Will Stock Market Perform Under Trump?
As we embark on a four-year journey with President Trump at the helm of the world’s largest economy, there are both knowns and unknowns.
Given...
Why Biotech Sector ETF (IBB) May Turn Bullish In 2025
One of the big themes we see emerging into 2025 is an expansion in Biotechnology and a bullish backdrop for certain biotechnology stocks.
While the...
2025 Stock Market Outlook: Bulls Try For 3 In A Row
Equities were riding high in November, thanks to the post-election rally following Donald Trump’s win and a decent earnings season. What was more encouraging...
German DAX Stock Market Signals Bullish Phase
The DAX is a stock market index consisting of the 40 major German blue-chip companies trading on the Frankfurt Stock Exchange.
The German economy, hit...


