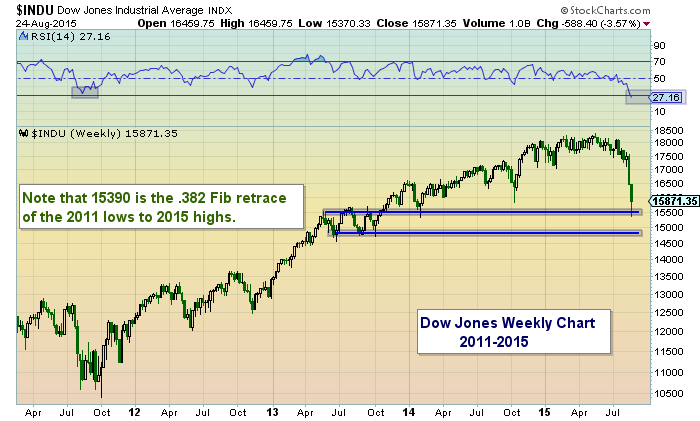
S&P 500 Market Update: A Look At Key Fibonacci Levels
Well, it's finally Friday. What a week. The deep move lower for stocks on Monday and gyrations that followed will give traders plenty to...
Dow Jones Industrial Average Nearing Critical Resistance Level
Monday was pretty scary for traders. Whether that's just a trading bottom or a more meaningful bottom, no one knows just yet. But it...
Global Bull Markets At Crossroads: Testing Key Channel Supports
The majority of the worlds stocks markets have been in an uptrend the past few years. The global stock market sell off now has...
Why Market Volatility Will Be Around For A While
There is a lot going on in the land of market volatility. Readings are extreme. On Monday, the Volatility Index (VIX) surged to the...
Spike In Fear Says Be Open To Market Bottoming Process
Some of the charts in this post are weekly charts, some are daily charts. To avoid confusion, you can see “Daily” or “Weekly” in...
My Thoughts On The Market Decline And A Technical Update
For the past several months, active investors have been trained to buy the dip. Or as many have said and written on Twitter, "just...
The Rotation Report: Stocks Got Ugly, And Fast
To end the week we saw some market carnage not seen since the last bear market. Friday, sectors and groups across the board crashed...
Market Correction In Full Effect For US Stock Market Averages
Greece couldn’t do it. Poor company earnings along with lower forward guidance couldn’t do it. Not even strong hints of a September rate hike...
Russell 2000 Futures: Volatility Creates Fib Swing Trade Setups
Below is a textbook example of a swing trade on the e-Mini Russell 2000 Futures (TF). And the recent volatility helped to create some big...
Gold Bugs Trend Change? Keep An Eye On This Ratio Chart
The chart below looks at the S&P 500 to Gold Bugs Index ratio over the past 20 years.
As you can see the ratio trended...


