Silver Bull Market Starting? Watch This Rare Bullish Signal!
When we discuss bull markets and areas of leadership, we usually point to out-performance.
We've been writing a lot about precious metals lately, and today...
Silver Breakout May Lead to Historic Price Rally!
Precious metals have been very strong over the past two years, with Gold breaking out of a historic bullish pattern. Is it time for...
Silver Rally Testing Major Breakout Resistance!
Precious metals have enjoyed a huge rally that has seen gold reach new all-time highs and silver reach new multi-year highs.
There are a lot...
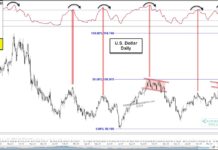
U.S. Dollar Peaking… As Momentum Indicator Reaches Historic High!
The U.S. Dollar is a key variable in all aspects of the marketplace. The strength of the dollar factors into the price we pay...
When Silver Looks Bad, It’s Been a Sign of a Bottom
Silver is pulling back sharply and it’s worth noting in the context of the broader market and trading or portfolio setups.
But before getting into...
Will Gold’s 12-Year Cycle Send It Much Higher?
Gold spent the better part of the past 12 years trading in a wide sideways pattern.
This type of price action tends to drive away...
Gold / US Dollar Attempting Historic Bullish Breakout!
I have spent a lot of time discussing the bullish implications of Gold price patterns and the recent Gold breakout attempt.
So why not offer...
Gold, CPI and Inflation: Historical Correlations and Analysis
In the face of higher yields, higher dollar, gold has been rallying since early March-and really since October 2023 after the trough.
Although there have...
Parabolic Market Moves and When To Walk Away
Since December 2022, we have been bullish gold in anticipation of its most recent run.
From the start of 2023, I went on the media...
Is Gold Warning Us Or Running With The Markets?
Having risen by about 40% since last October, Gold is on a moonshot. Many investment professionals consider gold prices to be a macro barometer,...


