Macro Investing Trends: 5 Stock Charts To Watch Now
Market trends and rotation occur in both localized (domestic) and global markets. With this in mind, it's important to understand that we have many...
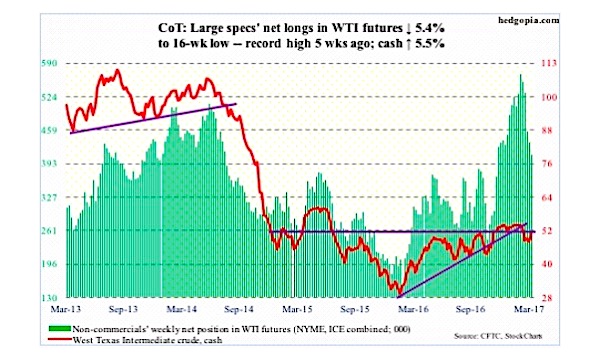
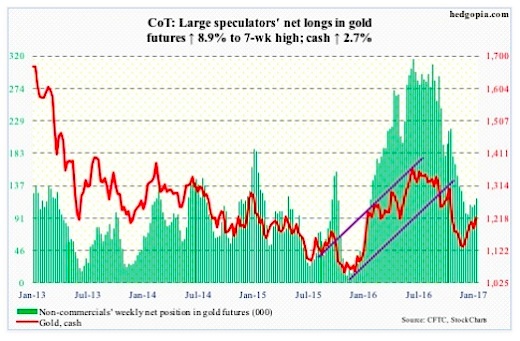
3 COT Report Charts For Commodities Traders
The following is a recap of the March 31 Commitment of Traders Report (COT) released by the CFTC (Commodity Futures Trading Commission) looking at...
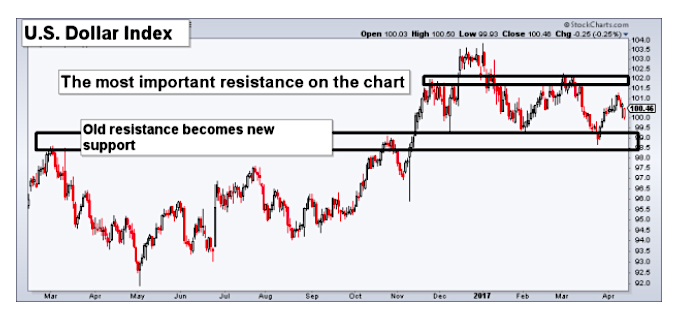
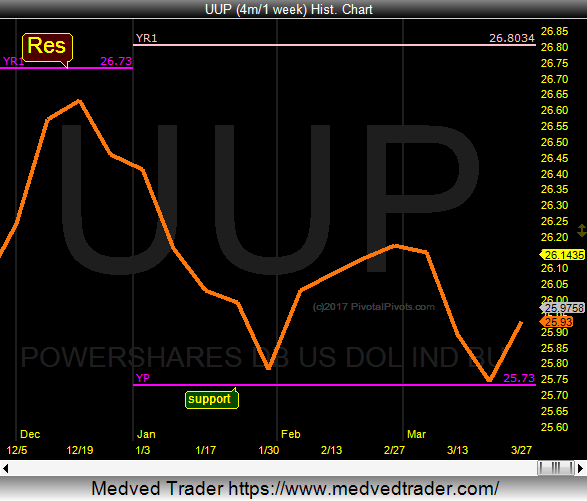
US Dollar Index Forms Double Bottom Pattern At Yearly Pivot
The US Dollar Index (CURRENCY:USD) and Bullish Dollar ETF (NYSEARCA:UUP) are forming a double bottom price pattern on their respective trading charts.
As well, both patterns are taking...
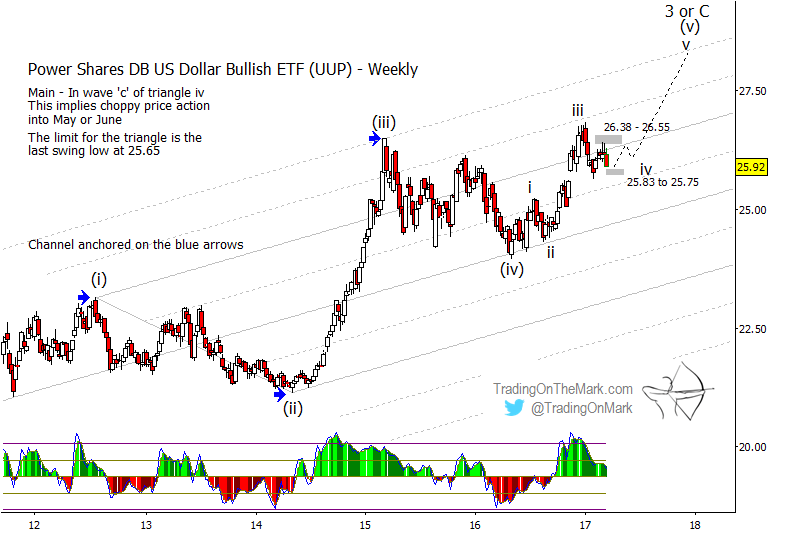
US Dollar ETF (UUP) Is Poised To Rise Further In 2017
If you acted on the bullish forecast we posted last May for the U.S. Dollar ETF, then you were happy to see price approach...
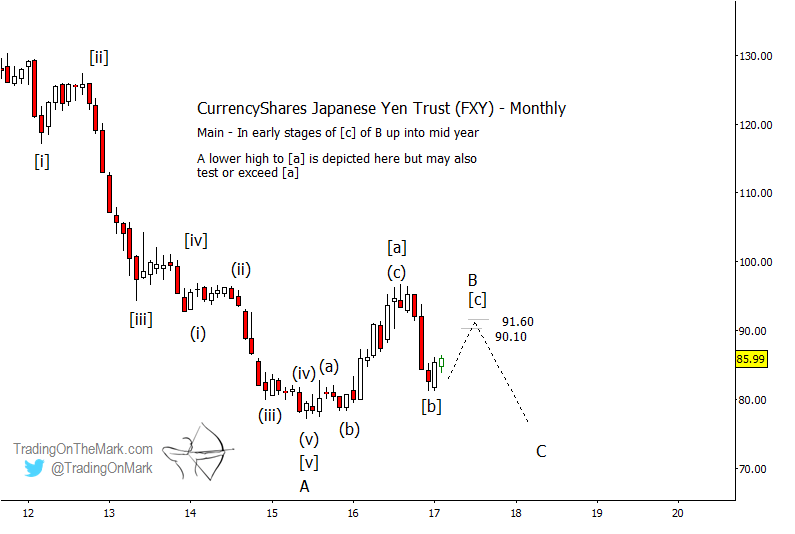
Japanese Yen ETF (FXY): Elliott Wave Upside Targets
As a follow-up to Friday's post about Yen futures, here we show some areas for the ETF trader to watch.
Charting the CurrencyShares Japanese Yen...
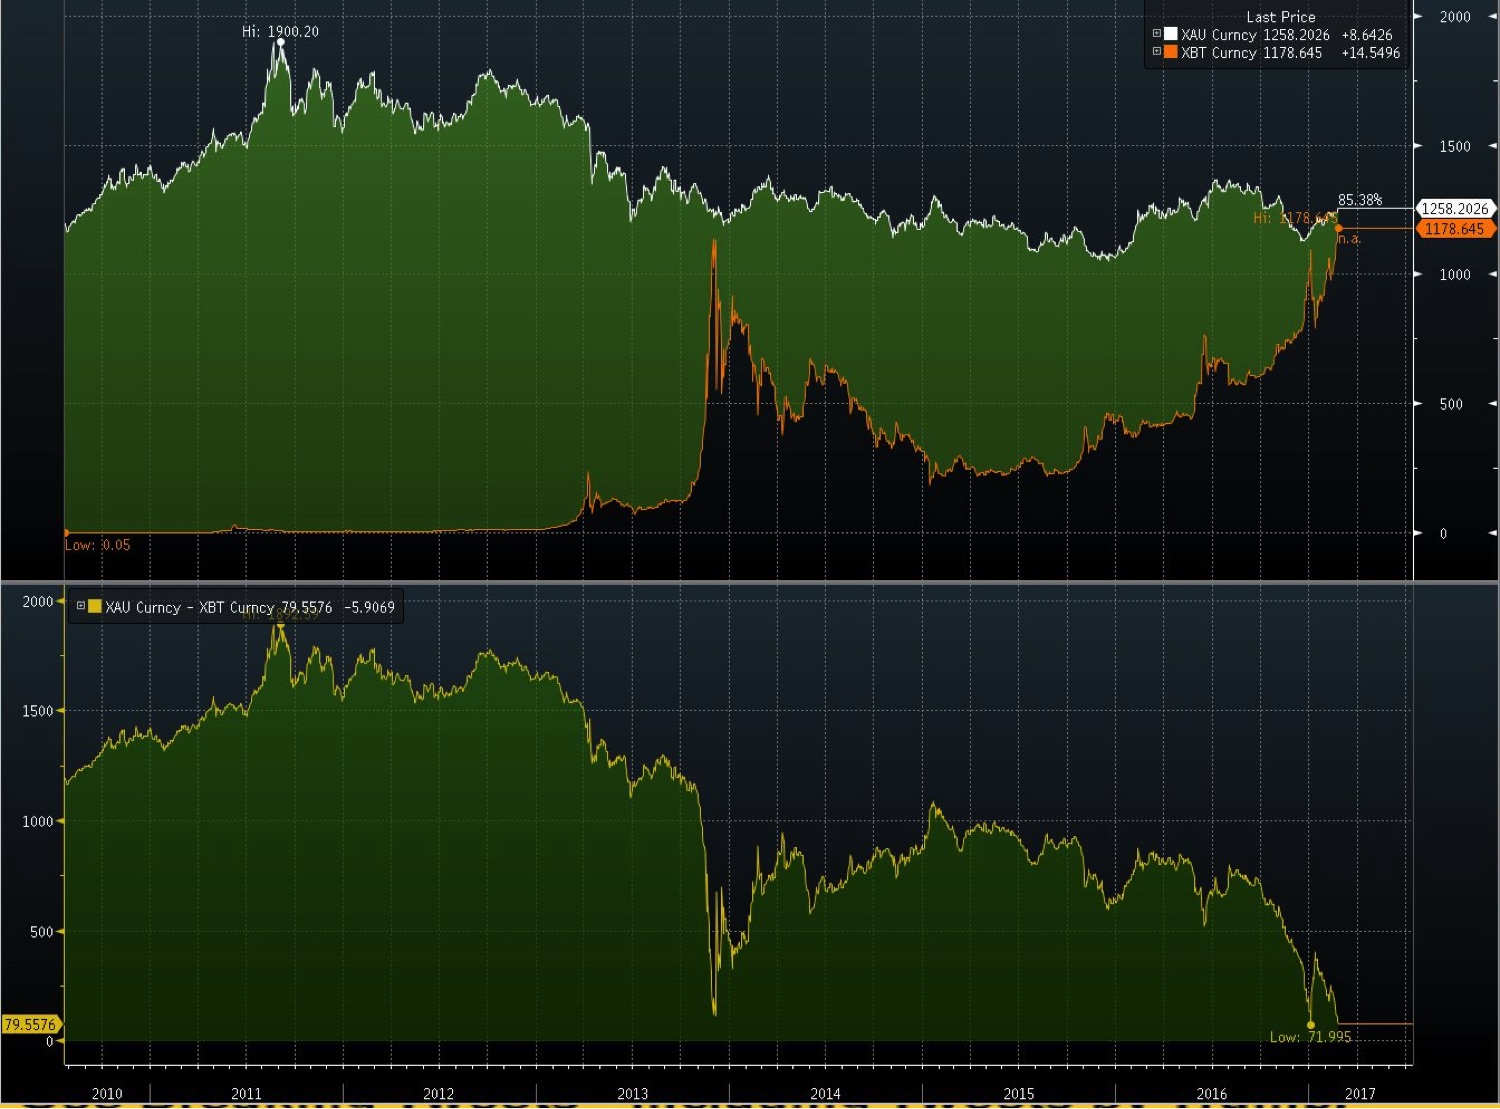
Bitcoin Trades Near Parity With Gold (chart spotlight)
While Gold (NYSEACA:GLD) has been on a tear in 2017. But as Bloomberg noted last week, Bitcoin is closing the gap!
Gold is trading at...
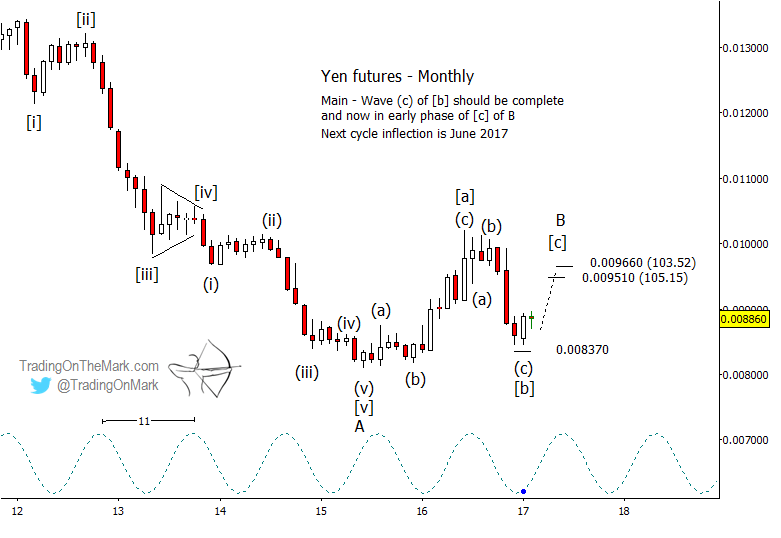
Japanese Yen Looks Ready To Rally
Last June, we presented a chart here at See It Market showing the decline we anticipated in the Japanese Yen, by way of a related...
Inside The Markets: 5 Charts For Active Investors (February 22)
It’s time for another round of macro technical charts as investors attempt to weigh the risk to reward ratio across several markets (including stock market indices,...
3 COT Report Charts For Commodities Traders (Feb 3)
The following is a recap of the February 3 Commitment of Traders Report (COT) released by the CFTC (Commodity Futures Trading Commission) looking at...
S&P 500 Trading Update: One More Push Higher?
Quick Update on the U.S. equity markets
US Equity futures are hanging around even, while most of Europe down about 0.50% as UBS is weighing...

