Can Stock Market Hold Up Amidst Soaring Commodities?
Last week the major indices made a successful rally back into a short-term support area. However, many see the price move as a rally back...
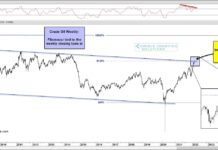
Crude Oil Prices See Volatility At 61.8% Fibonacci Resistance!
The geopolitical scene across the globe is gathering intensity as western countries and leaders clamp down on Russia for sending troops into Ukraine.
This has...
Commodity Price Index Near Most Overbought Level In 45 Years!
The CRB Commodity Index has rallied sharply over the past 2 years.
And although the index is not near all-time highs, it is getting stretched...
Bitcoin and Ripple Decline Toward Elliott Wave Trading Low
Cryptocurrencies like Bitcoin and Ripple appear to be sliding in a final Elliott wave trading move lower. And there is a lot of global...
Bitcoin Bearish Trading Setup Could Drop Crypto To 27000
As many of you know, my work is based on money flow indicators. We recently applied this to bitcoin trading to see what sort...
Stock Market Volatility Continues To Rattle Investors
The S&P 500 Index sold off by 1.01% on Tuesday as tensions between Russia and Ukraine continued; only 23% of the S&P's components finished...
Crude Oil Overbought, Elliott Wave Points To Pullback
It's hard to score profits by trading on news headlines, and the current environment makes it even harder. We prefer to rely mainly on...
Gold Nears Inflection Point, As Narrowing Pattern Echos Key Currencies
The price of Gold has been consolidating for several months. And just when you think it's going to breakout, sellers show up.
But Gold hasn't...
Crude Oil Rally Reaches Super Breakout Resistance!
Inflation has been a growing worry for investors and consumers alike. And Thursday's Consumer Price Index (CPI) data didn't help, showing a 7.5% spike...
Metals GOLD and Palladium Complete The Recovery: Elliott Wave Analysis
The U.S. equity markets have traded in a range as traders and investors await CPI data tomorrow.
Gold made a sharp and strong turn down...


