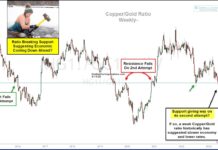
Economic Slowdown, Falling Interest Rates and Inflation? This Ratio Says Yes!
The world is full of economic concerns. Inflation, economic slowdown, global trade, and international war.
So what's next?
Today's chart might just might share a glimpse...
A Closer Look At Currencies, Metals and Soft Commodities
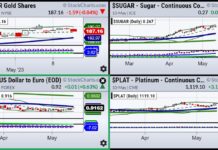
For today, I am including a clip that covers currency pairs and several commodities.
The four-chart screen is a daily screenshot of Gold (GLD), Sugar...
Commodity Price Patterns Signaled Caution Despite Russian Invasion!
Market prices absorb all the information that's out there. Perhaps that's why several commodity prices surged in the months leading up to the Russian...
Gold Bulls Are Hoping 3rd Time Is The Charm!
The precious metals sector has remained elevated, yet volatile, over the past two years. Call it consolidation, but in my humble opinion, something has...
Is Crude Oil About To Send An Important Global Message?
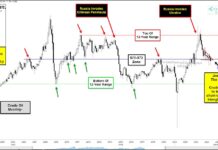
The past 12 years have seen some really big swings in the price of crude oil. And the latest swing higher into 2022 played...
Another Market Collapsing
The real reaction to Wednesday’s Federal Reserve meeting is likely to happen Thursday.
All eyes and ears were on Chairman Jerome Powell today. Most notable...
Will The Federal Reserve Make Gold Shine?
Stocks began the day weak, and weaker than most traders probably realized. As you can see in the intra-day chart below, short-term momentum, as...
Precious Metals Next Big Move Hinges On U.S. Dollar!
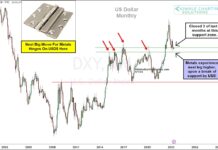
When the US Dollar broke out to new highs last year, it looked like nothing could stop the greenback. And the headwind of a...
Now That “Stagflation” Has Gone Mainstream
This is just one of several headlines about stagflation we have seen this week:
April 27, 2023 TheStreet.com
Stagflation Risks In Focus As U.S. Economy Slows,...
Palladium Futures Trading: Bullish Buy Signal (Flag Pattern)
I like the recent price action in Palladium futures.
Over the past several weeks, Palladium has formed a nice cup-like basing pattern and recently turned...


