Equity Market Spotlight: A Review Of The Oil Complex
Every significant decline kindles the spirit of catching the bottom. It is a 'demon' that every investor, professional or private, seeks to control in...
Gold Volatility Surges As Gold Prices Try To Break Out
Gold bugs may need to step up to the plate. Although gold prices are surging, so is the Gold volatility index... and just as...
Is The Gold Bear Market Nearing An End? (3 Charts To Watch)
While the focus for 2016 has been squarely on equities, China, and oil, gold has been an interesting market to follow for the beginning...
Stock Market Futures Push Higher; Crude Oil Rallies
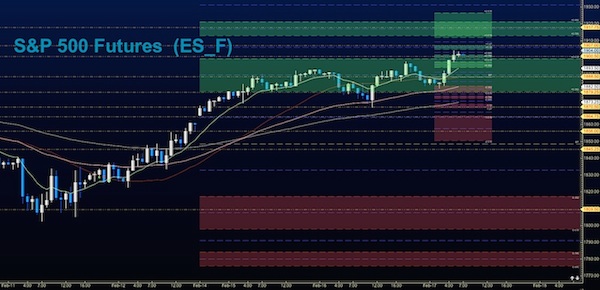
Stock market futures continue to expand into higher resistance for yet another day. Crude oil futures are also pushing higher, giving futures traders a bit...
Stock Market Futures Rally Into Key Resistance Friday
As I mentioned yesterday morning, wicks did develop near stock market futures lows yesterday, and charts did see buyers step up into value areas.
The...
Gold And US Treasury Bonds Are At Price Extremes
A combination of recent central bank action and current talk of negative interest rates has brought out a thick wave of investor uncertainty in the...
S&P 500 Futures Decline As Market Tests January Lows
Roiling markets around the world are once again disrupting the equity futures market. And China woes have helped to propel S&P 500 futures into...
Stock Market Futures Lower In Downside Continuation
Stock market futures are trading sharply lower this morning. A cascade of selling on Friday continued after the break of the 1902 contested levels....
This Isn’t The Stock Market You Imagined: Welcome To 2016
As they say, history often rhymes... But it rarely repeats. Or at least in the way that we imagine.
That's not to say that looking...
S&P 500 Futures Clinging To Key Support; Battle Lines Drawn
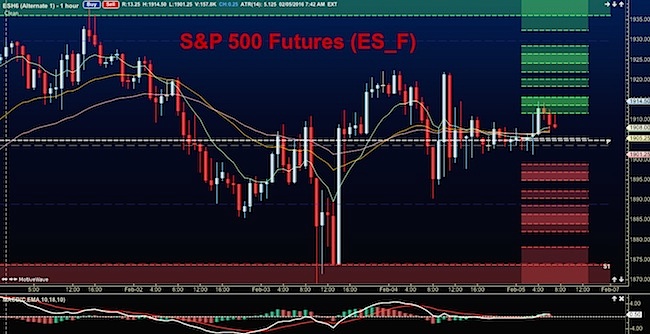
Yesterday was an aggressive day of range-bound trading that left traders battling at lines of major congestion between 1902 – 1907 on S&P 500 futures.
With...


