US Corn Futures Weekly Outlook: Ethanol Production In Focus
March corn futures moved higher this week, closing up 2 ¾-cents per bushel week-on-week, finishing on Friday (2/3) at $3.65 ¼. CH7 continued to...
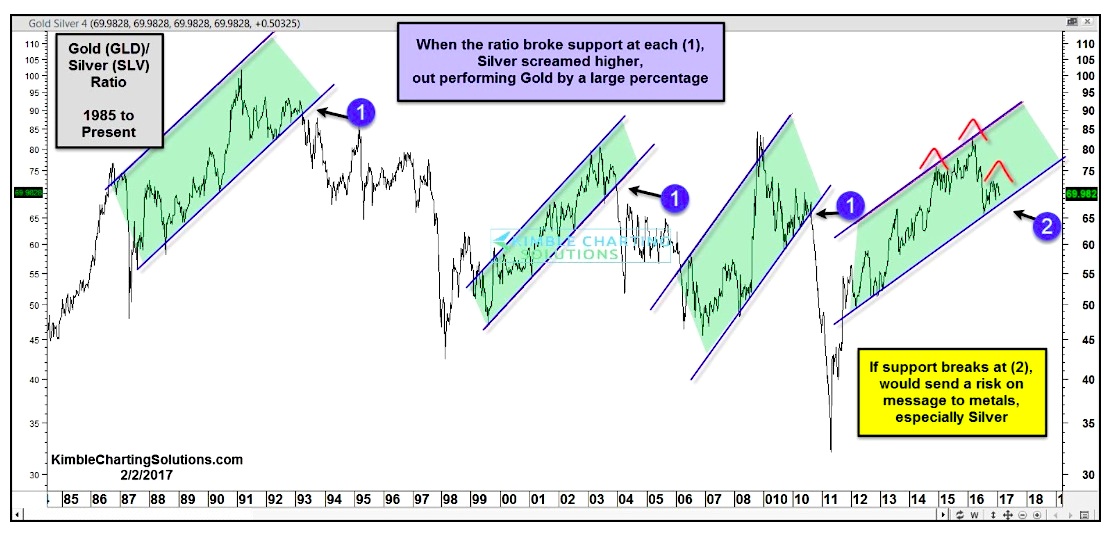
Gold To Silver Ratio At Critical Juncture Historically
One chart that provides a good indicator for precious metals followers is the Gold to Silver ratio.
Below is a chart looking at the ratio...
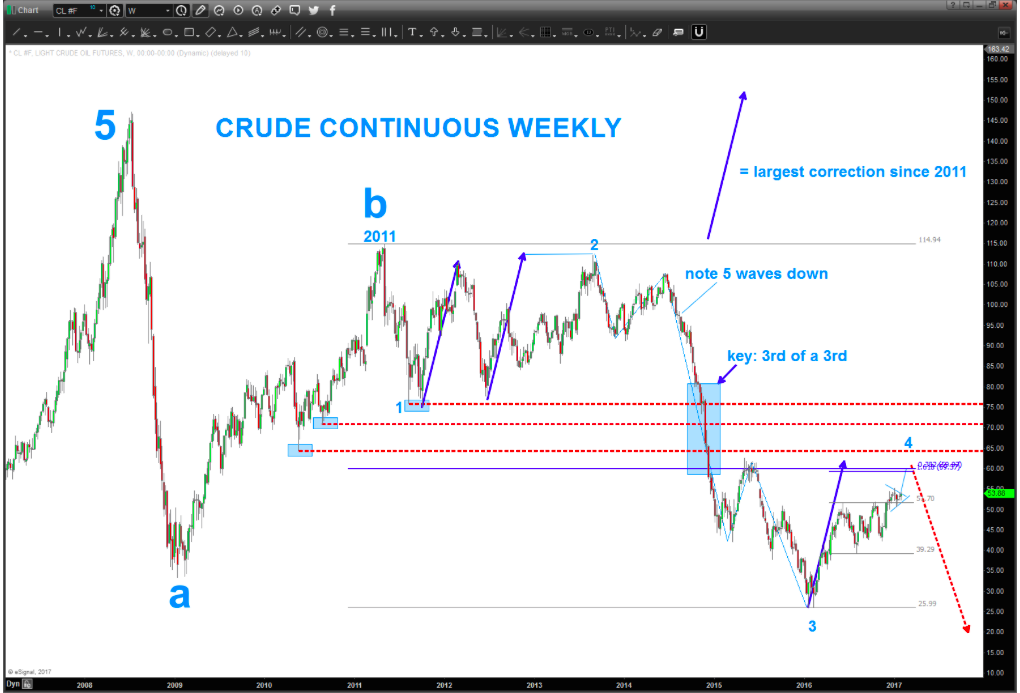
Crude Oil Chart Update: Elliott Wave 4 Higher?
I can’t believe it’s been over a year since I posted on crude oil. I covered it last on See It Market in November 2015,...
S&P 500 Futures Trading Outlook For February 2
Stock Market Futures Trading Considerations For February 2, 2017
The S&P 500 (INDEXSP:.INX) may be setting up for an inside day, but that doesn’t mean...
5 Charts To Watch This Week: Breakouts & Divergences!
It’s time for another set of macro technical charts to watch as we prepare for the month of February (including stock market indices, sectors,...
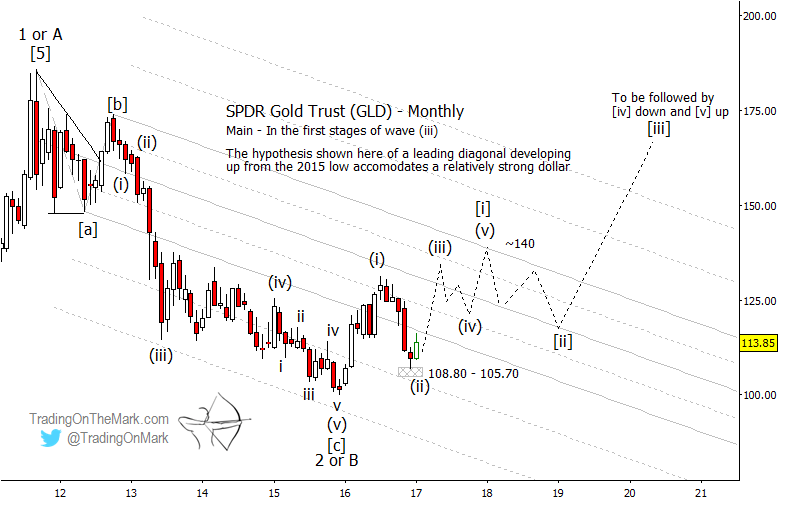
Gold Update (GLD): 2 Elliott Wave Scenarios To Consider
It was late August when we suggested that See It Market readers should watch for a pullback in gold prices. In subsequent months, shares...
S&P 500 Futures Trading Outlook For January 30
Stock Market Futures Trading Considerations For January 30, 2017
Most of our FOMC weeks have logged a bit of movement, and this week should be no...
5 Charts For Traders: Gold, US Dollar, CBOE SKEW and More
It’s time for another set of 5 macro technical charts to watch as we move toward the end of January (including stock market indices, sectors, individual...
S&P 500 Futures Trading Outlook For January 24
Stock Market Futures Considerations For January 24, 2017
Not much more to say here other than our ranges continue to hold the tight forms. At some point, the...
Natural Gas Futures: Bearish Signals Show Up On Weekly Chart
Natural Gas prices are seeing rather dramatic volatility from one weather model run to another in recent weeks.
Rather than trying to figure out what...


