Undermining Capitalism with Unreal Values and Crass Distortion
“Compared to What,” a classic jazz tune written in 1966, became famous in 1969 by Les McCann and Eddie Harris at the Montreux Jazz Festival....
U.S. Stock Market Indicators Remain Bullish But Eyes On Inflation Data
The S&P 500 Index is flat for the week as Wednesday's trading session kicks off. That said, it is notable that the S&P 500...
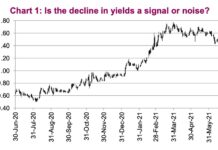
Is Bond Yields Decline An Economic Signal… Or Noise?
The SNR (signal to noise ratio) is a measurement often used in science and engineering that compares the desired signal with background noise.
This thought...
Is US Treasury Bonds ETF (TLT) Ready For A Pull Back?
The US treasury bond market is enjoying a multi-week rally. Bond buyers have targeted the bond market and are pressuring bond prices higher into...
Long-Dated Treasury Bonds (TLT) Nearing Major Trend Test
Long-dated treasury bonds have been out of favor since the coronavirus market crash in February/March 2020.
Not only were bonds trading at the highs (and...
Federal Reserve Causes Gold Sell-off; USDCHF Currency Headed Higher (Elliott Wave Analysis)
US dollar is up sharply as 7 Federal Reserve officials expect rates to increase in 2022, 13 Fed officials see rate increase in 2023....
Is Stagflation Creeping Into US Economy?
After Wednesday’s Fed announcement, the stock market has been sitting in an uneasy state.
The U.S dollar (UUP) has not only firmed but has pushed...
Will Government Bonds Continue To Sink Lower?
US government bonds have come under pressure over the past year. And that decline has come to an important inflection point.
Time to bounce higher?...
Stock Market Bulls Eye Junk Bonds (JNK) and Small Caps (IWM)
Tuesday, the Russell 2000 (IWM) closed over its pivotal price area of $226.69 from April 6th.
Now it needs to hold over this price level...
Got Bonds? Federal Reserve Taper Is Coming
The solid economic recovery and easing of COVID restrictions lead me to believe a tapering of QE may not be far off. Further supporting...


