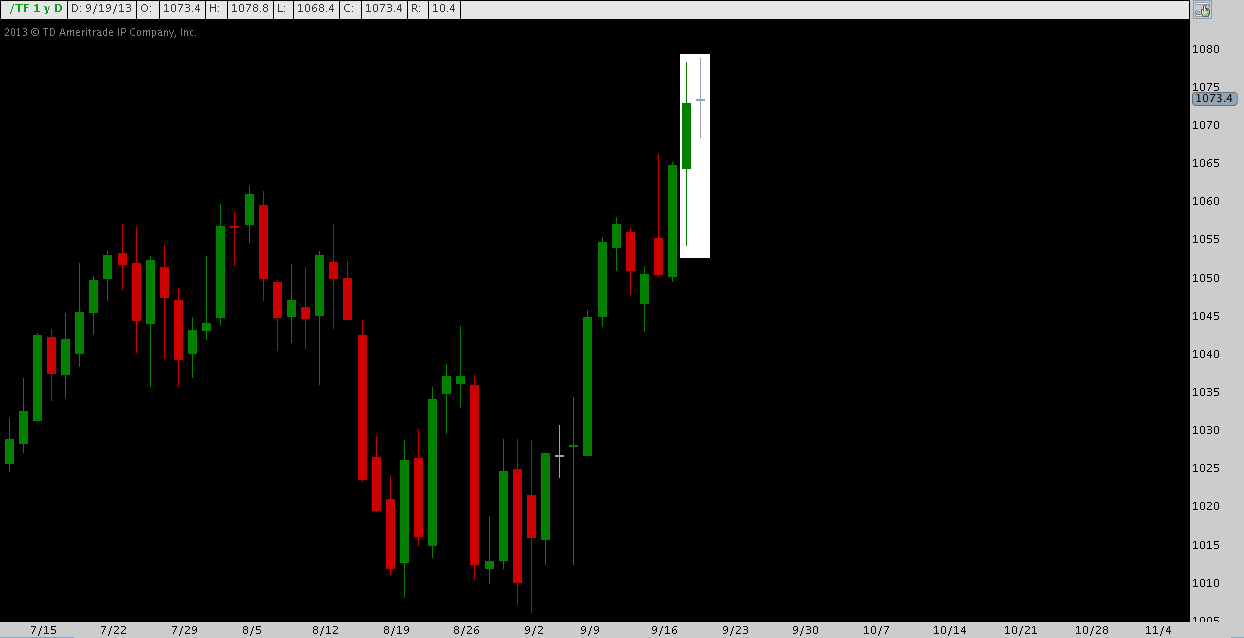
As improbable as it may seem, the December Russell 2000 Mini Futures (TF) contract traded +0.5% up and -0.5% down from its opening price; but ended where it began the session Thursday, entirely unchanged at 1073.4. In the parlance of candlestick analysis, we refer to any period like this – whether the time measured is one minute or one year – that trades up and down but ends then unchanged as a doji.
Taken by itself, a doji signals a stalemated market: often described as “indecision”, think of it as a point of equilibrium where longs and shorts reach momentary agreement – or at least, a truce – over value. The inability of price to get away from where it begins over the period measured is indicative of a ranging or trendless market.
Whether it describes a period one minute or one year, a doji occurs in the wider context of the candles around it which gives the single-candle moment of market stasis the doji represents a broader, multi-candle meaning. There are many iterations of multi-candle patterns in the broader discipline of candlestick analysis featuring the doji – here we’ll focus specifically on the emerging pattern setting up on TF right now.
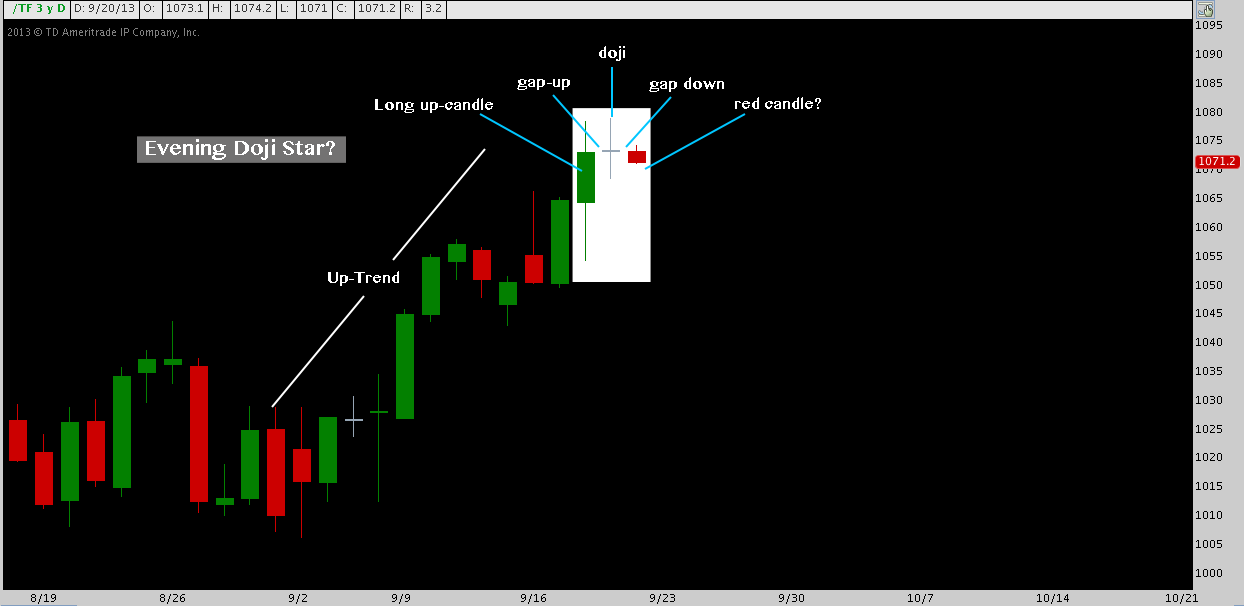
One such iteration finds the doji preceded by an up-trend, i.e. by one or more up (or white) candles. Where the latest white candle is tall and separated from the doji by a gap-up across which the candle bodies (the distance between open and close) do not overlap, the pattern is referred to as a bearish doji star.
Because they feature a decisive up-day and the initial bullish follow-through of an opening gap higher, doji stars occurring in an uptrend are best described as “sober reconsideration”, telling of a long side initially gathering force, but then calling a screeching halt to deliberate over whether or not to continue. Whether longs relinquished it or shorts forcibly wrested it back, the doji star connotes a balance of market control. As it turns out, candlesticks have quite a bit to say about the prevailing sentiment among buyers and sellers.
The bearish doji star is the two-candle pattern present on TF, composed of FOMC day (Wednesday) and Thursday. In light of the explanation above, the candlestick analyst can reasonably infer that the FOMC’s announcement of “no taper” was well-received initially; but as the culminating event capping a swift +7% up-leg off TF‘s 1006 September low, Wednesday’s bullish momentum was supplanted “sober reconsideration” Thursday as the market digested the implications of the FOMC decision.
What does this mean for TF and the wider equity market as a whole? Simply that the up-trend was placed on pause. As such, the implications of the bearish doji star are all but random. In fact, Thomas Bulkowski finds that bearish doji stars function as bullish continuation patterns in practice, but that their subsequent bullish performance is not impressive.
But what about where the bearish doji star doesn’t break higher but is followed by an opening gap lower and the bearish continuation its name promises? The pattern is then referred to as an evening doji star.
In this case, the pattern title isn’t disingenuous: evening doji stars do carry bearish significance – in fact, Bulkowski observes the pattern, while comparatively rare, precedes a bearish continuation 71% of the time.
TF did gap lower on reopening for trade last night, setting the stage for an evening doji star. If Friday’s session ends in the red and retraces to 1068 or lower (the shadows/wicks aren’t relevant to this pattern, by the way), the criteria for an evening doji star are met, signaling a pullback from Wednesday’s post-FOMC highs is probable.
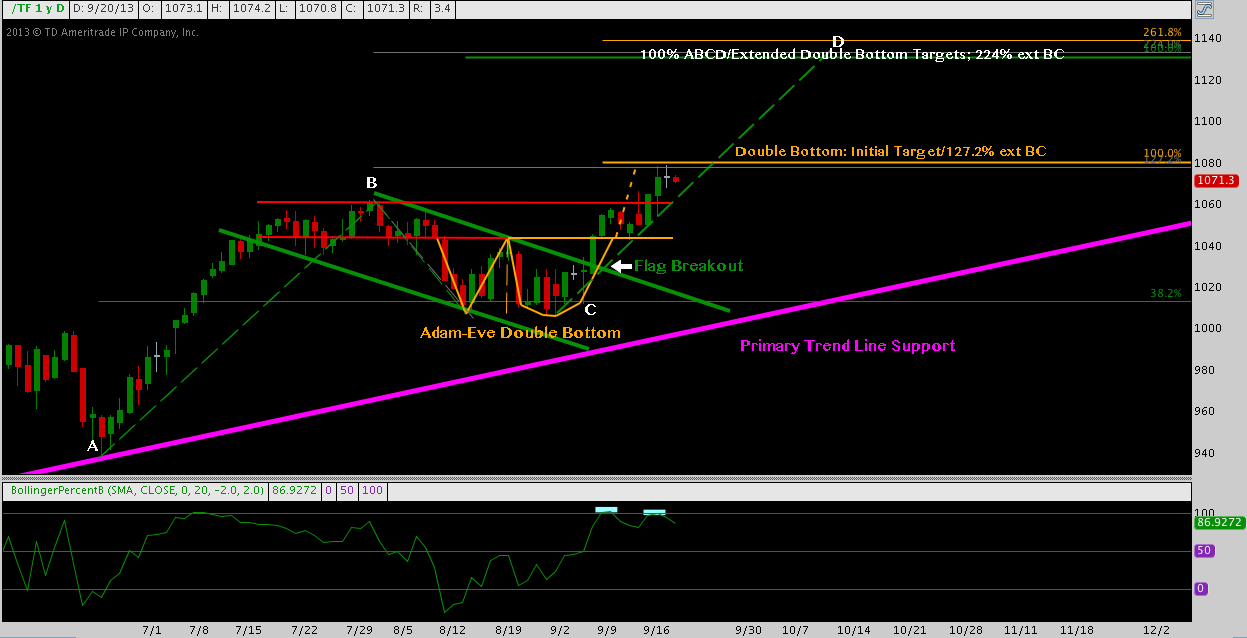
As we discussed above, moving from any single candle to its immediate multi-candle context, though obvious and basic, is crucial to sound candlestick analysis. Going a step further, the wider technical backdrop is vital to understanding the (in)significance of a given multi-candle pattern. In this case, the evening doji star arrives at noteworthy short-term level just below the cluster resistance present at 1080:
Keeping in mind that once above 1080 market tone shifts higher again and a evening doji star is entirely negated: if this pattern does emerge by end-of-day Friday, its placement in the shadow of a significant short-term pattern target and a key fibonacci extension level just above only serves to heighten the probability it is signaling further downside to come.
Twitter: @andrewunknown and @seeitmarket
Author holds no positions in instruments mentioned at the time of publication.
Any opinions expressed herein are solely those of the author, and do not in any way represent the views or opinions of any other person or entity.


