Over the weekend we covered the weekly charts of our favorite stock market ETFs, which we call the “Economic Modern Family”. You can read that here.
All the original Modern Family (Russell 2000 IWM, Retail XRT, Transportation IYT, Regional Banks KRE, Biotechnology IBB, and Semiconductors SMH), posted gains today as the stock market rallied with strength.
Our newest member, Bitcoin, also posted gains.
We also looked at the NASDAQ 100 (QQQ). That ETF also (QQQ) posted gains.
In fact, QQQ gained the most percentage-wise.
We could say All in the Family has begun this week happy and healthy.
Now, let’s look at the long bonds TLT.
With mixed economic signals, an upcoming FOMC, earnings on tap, and the election cycle upon us in full swing, the TLT is a moving piece to watch for many reasons.
Click here to read more on long bonds, plus levels for key ETF indices and sectors.
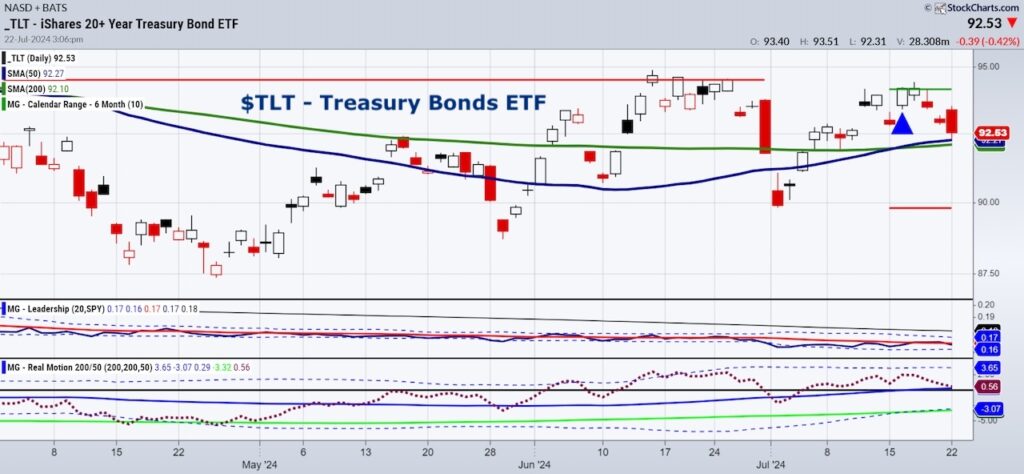
On the positive side for the overall market, SPY maintains its lead over TLT.
For risk on, that is exactly what you want to see.
As far as price, TLT failed to pierce the July 6-month calendar range high (green horizontal line).
However, the price sits above the 50-DMA (blue) after a golden cross last week.
TLT is in a bullish phase.
On Real Motion, the red dots sit on the 50-DMA, which means at this point, the momentum is in line with price.
What we can conclude is that TLT is holding up as rates have peaked.
Nonetheless, we have yet to see real evidence of rates coming down, which is ok provided the economy can hang in there.
Should TLT clear July highs, we see a potential shift in the landscape with fears of recession starting to emerge.
Twitter: @marketminute
The author may have a position in mentioned securities at the time of publication. Any opinions expressed herein are solely those of the author and do not represent the views or opinions of any other person or entity.


