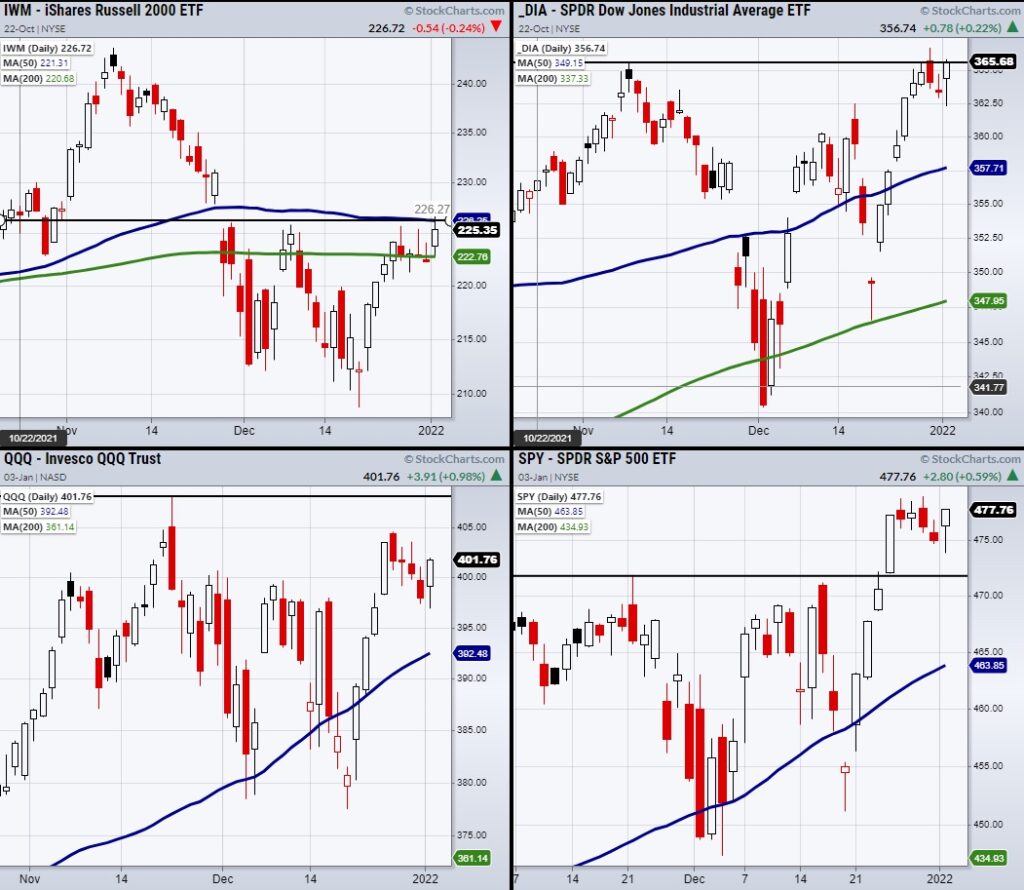
After a roller coaster start to a new year with major indices having a choppy Monday morning, each has closed positive showing traders optimism for the beginning of 2022.
However, the major indices including the S&P 500 ETF (SPY), Nasdaq 100 ETF (QQQ), Russell 2000 ETF (IWM), and the Dow Jones Industrials ETF (DIA) are not out of the water yet and will need to break through key resistance or hold main support to continue upward.
The above chart shows key price resistance or support levels each index ETF (by ticker symbol) needs to clear and hold over.
SPY — $470-473 is price support
QQQ — $408.71 is price resistance
DIA — $365.64 is price esistance
IWM — $226.73 is price resistance from the 50-day moving average.
With that said, what matters more is not only that these levels are cleared but going into the new year we see an upward trend from these areas.
The biggest problem we can run into in 2022 is sideways and rangebound trading.
For example, IWM has already been rangebound through 2021, however, if the Nasdaq or SPY fall into the same price action this could mean trouble ahead.
Therefore, watch for these resistance levels to not only clear but to consolidate over before pushing higher.
Stock Market ETFs Trading Analysis & Summary:
S&P 500 (SPY) 470-473 support
Russell 2000 (IWM) Able to clear over 224 resistance. Needs to clear the 50-DMA next.
Dow (DIA) Confirmed bullish phase with second close over the 50-DMA at 356.43
Nasdaq (QQQ) 404.58 to 408.71 resistance.
KRE (Regional Banks) Watch for second close over the 50-DMA at 71.89
SMH (Semiconductors) 318.82 to clear.
IYT (Transportation) Showing consolidation over 274.
IBB (Biotechnology) Needs to clear 155.
XRT (Retail) Lots of overhead resistance at 94 area.
Twitter: @marketminute
The author may have a position in mentioned securities at the time of publication. Any opinions expressed herein are solely those of the author and do not represent the views or opinions of any other person or entity.


