We are clearly in some sort of artificial intelligence (AI) bubble with many of the common bubble characteristics present.
AI is a disruptive technology that is changing the way people do things, with very wide applications. There has been a sharp rise in the prices of companies involved in AI.
Initially price gains were driven by improving profit outlook, but increasingly the importance of fundamentals fade. The speculation is spreading outwards; the latest was a rally in utilities given the power consumption of data centers. And given the size of the companies at the top of the AI trend, there is a strong belief you need to own some to keep up.
AI is awesome, a tool our team is increasingly using. Synopsis of minutes/action items from meetings, a replacement for other search engines, coming up with “original” comments on birthday cards, or even just getting started to write any content. You have to check the facts as it’s often inaccurate, but it can help create writing structure or flow. For the record we have not used AI in our market analysis so far.
AI helps us on coding now, speeding up the process. The resale value on my O’Reilly books has probably plummeted. Bloomberg analysts trained their native AI to produce key points from company earnings calls – very useful. The point is, we are fans but it’s still a bubble.
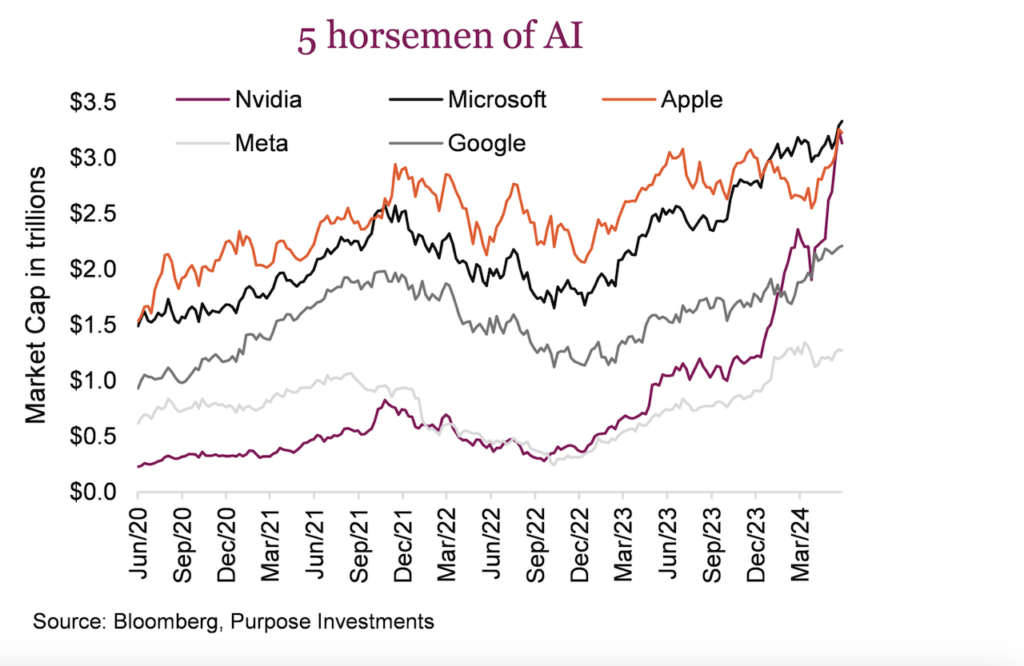
The big question is, using the 1990s dotcom bubble as a loose comparison, is this 1997, 1998, 1999 or 2000? Are the four horsemen of the internet, now the four/five horsemen of AI? Much like in the 1990s, this has resulted in an insanely narrow market. Three companies, Nvidia, Microsoft and Apple, now carry market valuations of about $3.2 trillion each. Given their returns and size, if you don’t own any of them you are likely suffering from some underperformance. If you own all them, well, you are probably winning in 2024.
These five names are now 27% of the S&P 500. From a historical concentration perspective, that is very high concentration for the S&P 500. And this does add risk. Owning none has risk too – risk of being left behind. Even the well-performing core dividend strategy we manage does own some via Microsoft. We sure ain’t there for the 0.7% dividend.
Of course we could talk valuations as a warning sign, but as we highlighted earlier, valuations don’t matter as much when investor euphoria takes over. Valuations didn’t matter in the 1990s and they didn’t matter during the nifty 50 bubble of the late 60s/early 70s. Maybe that is taking it too far – valuations did matter in the end but certainly didn’t help signal a peak or reversal of trend. And today, the market capitalization weighted S&P is trading at 21x forward estimates, a 4.5 premium to the equal weighted equivalent. That is probably the highest spread since the 1990s. Doesn’t mean it can’t continue though.
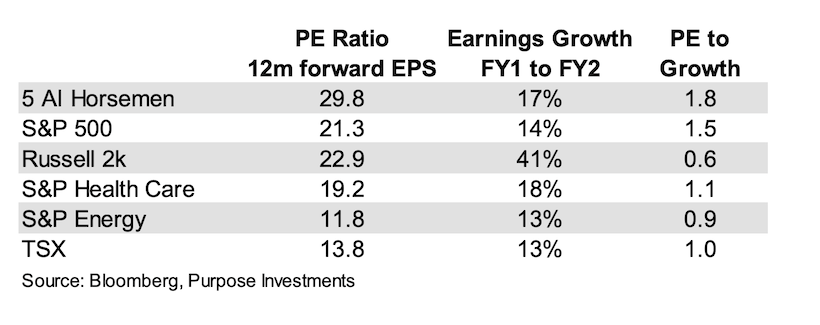
Framing valuations another way, this table is the price-to-earnings ratio based on consensus earnings for the next twelve months, earnings growth for the current fiscal year to next and a PEG ratio. PEG is price to earnings to growth. The 5 AI Horsemen certainly have decent growth, but their size is a challenge. Microsoft has annual sales of $236 billion, and to move that needle you need a really big push.
The broader market, trading at an 8 point discount, is expected to grow just 3% less at 14%. We threw in a couple sectors that are interesting as well. Sure energy should trade at a discount given its cyclicality, but health care? The S&P health care sector is trading ten points lower than the AI group and has similar near-term earnings growth.
Of course AI could continue to drive estimates higher and higher. That is the supporting argument for the continuation of the bubble. Possible, but certainly a rose coloured glasses scenario. Then again, valuations don’t matter until they do.
One area that is becoming a bit more concerning is market breadth. Measuring the percentage of companies trading above their 50-day moving average, it is not healthy for a market that is making new highs. Ideally, markets make new highs with broad market breadth, implying many companies are participating in moving the overall index higher. Currently about 50% of the S&P 500 member companies are trading above their 50-day. It isn’t terrible but it isn’t good either. On average, when the S&P is up over 10% during the previous six months, breadth is around 70%. With the S&P 500 up 13% over six months, a breadth of 50% is low.
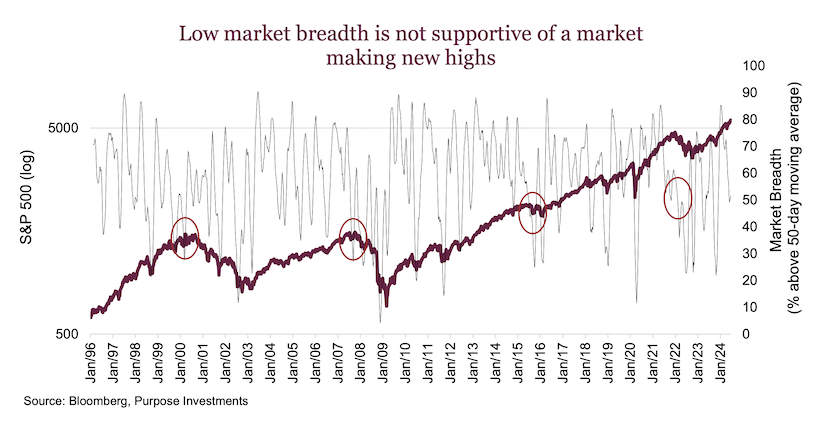
50% is low but not dire, and of course it could improve or falter. We would point out it dropped to between 30-40 at most previous market peaks that were followed by big declines (red circles). Acknowledging this is no magic bullet, since there are many times when breadth fell to low levels and markets weathered through to move higher. Nonetheless, breadth is not very supportive.
Final thoughts
We are excited about further AI deployments and advances. Will markets take things too far? Absolutely, that is what markets do. So back to the question at hand. If this market has similarities to the 1990s dotcom bubble, what year is it? Closer to 2000 than 1997 in our opinion. The excitement is there. Outside of GPU chip sales, few talk about the economics of the initiatives. Nobody is talking valuations based on eyeballs yet, but it feels close. The temporary spillover to utilities sounds like late bubble behaviour as well.
Turning points in interest rates often coincide with changes in market leadership too. We all cheer for the Fed to start cutting rates, but given the oversized weight of the current cycle winners, if this coincides with leadership change be careful what you wish for. The math will prove challenging.
Source: Charts are sourced to Bloomberg L.P., Purpose Investments Inc., and Richardson Wealth unless otherwise noted.
The author or his firm may hold positions in mentioned securities. Any opinions expressed herein are solely those of the authors, and do not in any way represent the views or opinions of any other person or entity.
 and Semiconductors (SMH)")
 Make A Higher Low?")


