The stock market bounced a little bit this week but several sectors and indices are still in trouble.
One such sector is the tech leadership group, the Semiconductors $SMH.
And we have written no shortage of articles on this key sector. Check out these recent Semiconductor articles:
“Are Market Leading Semiconductors Reversing Lower Again?“
“Tech Stocks Leadership Reaches Important Trend Line Support“
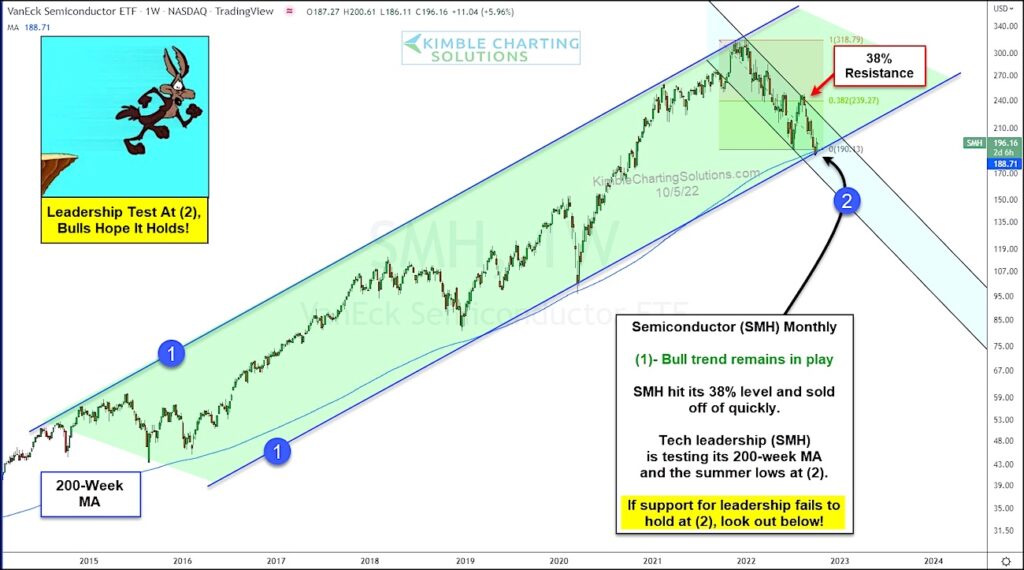
Today, we share a critical update. The decline in the Semiconductors (SMH) is at an important inflection point. As you can see on the long-term chart below, $SMH rallied to the 38% Fibonacci resistance level at the top of its falling channel before turning sharply lower.
That decline is testing key long-term trend support in its rising trend line as well as 200-day moving average at (2). Tech bulls need to put this on their radar now.
In my humble opinion, it is critically important that this leadership group holds support at (2)! Stay tuned!
$SMH Semiconductors ETF “monthly” Chart

Note that KimbleCharting is offering a 2 week Free trial to See It Market readers. Just send me an email to services@kimblechartingsolutions.com for details to get set up.
Twitter: @KimbleCharting
Any opinions expressed herein are solely those of the author, and do not in any way represent the views or opinions of any other person or entity.


