Chipotle Mexican Grill (CMG)has hit the mother of all storms and it has resulted in a very sharp and swift decline in Chipotle stock price.
Chipotle’s battle with an E. Coli breakout has been well documented. And it’s hit Chipotle’s stock price, with shares declining in excess of 40 percent since October.
But I was writing about Chipotle stock price and potential topping pattern since last spring (long before the news of health concerns). In sum, the stock chart for Chipotle looked like a top in $CMG was forthcoming.
That top has played out and much of the damage to the downside has been accelerated due to the news and concerns. But even in the early going, it was clear that the Chipotle stock chart was broken over the near-term.
If we look more closely at the chart, again focusing solely on price and math, we can see what’s happened and draw a couple of lines in the sand at new price support and resistance levels.
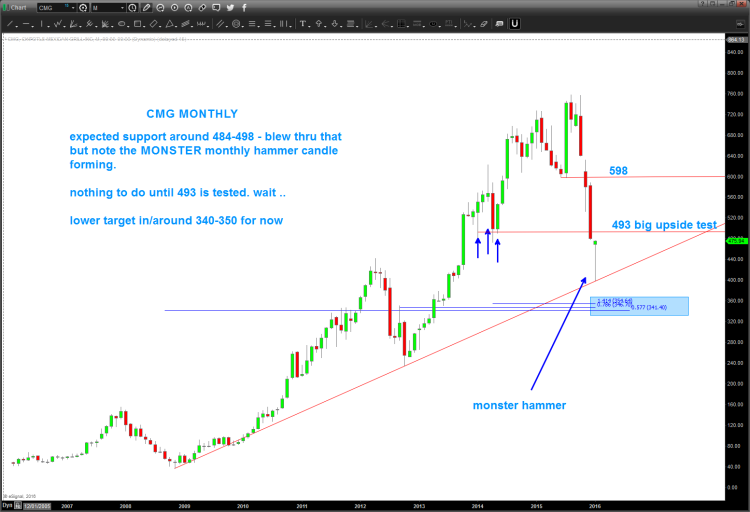
The January monthly candlestick for Chipotle stock price looks set to put in a monster “hammer” candlestick. In short, the stock stretched all the way down to the 50 percent retracement of the all time high/low (yes, it lost roughly 50% over the past 6 months) and rallied. That is current price support. I see $493 being an important number to the upside but think that sitting on our hands is the best solution until the stock bases/retests and breaches 493 to the upside.
Chipotle Stock Chart (CMG) – monthly candlesticks
Thanks for reading and stay disciplined.
Twitter: @BartsCharts
Author does not have a position in mentioned securities at the time of publication. Any opinions expressed herein are solely those of the author, and do not in any way represent the views or opinions of any other person or entity.


