Common sense tells us, even in the strongest of strong bull markets, we can find concerning data points and scary narratives.
There is always something to be concerned about. Markets move based on the weight of the evidence.
Therefore, we are constantly evaluating present-day data points and looking for signals that confirm or contradict the bullish hypothesis that was formed in early January 2019.
Today we look a market breadth indicator (and recent signal) for the S&P 500 Index – INDEXSP: .INX
THIS JUST HAPPENED
The only way we can really understand if a signal leans bullish, bearish, or neutral is to ask and answer the following question:
How many times has it occurred in the past and how did the stock market perform after past signals?
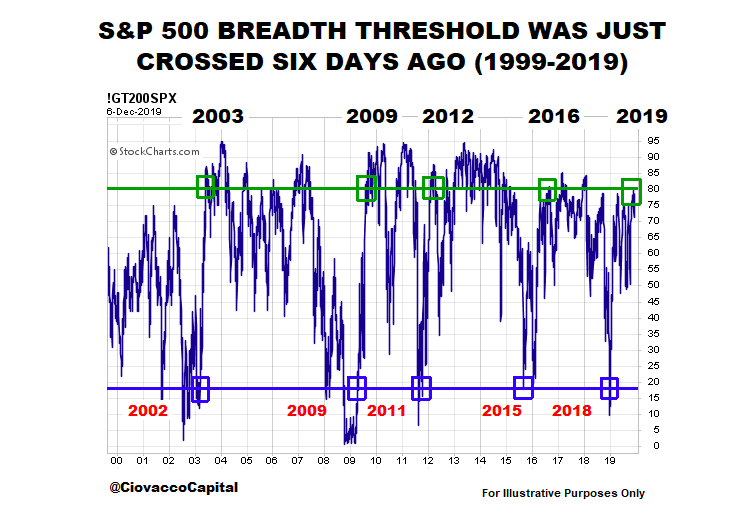
The chart below shows the percentage of S&P 500 stocks above their 200-day exponential moving average. It is rare for this breadth indicator to drop below the blue line, which is indicative of extreme pessimism about future economic and market outcomes.
If you know market history, you know most signals that began to form in 2002, 2009, 2011, and 2015 turned out to be great “keep an open mind about better than expected outcomes” signals. The signal shown below is triggered when breadth gets oversold (below the blue line) and then makes it all the way back to the green line. The last round trip took place between late December 2018 and late November 2019.

HOW DID STOCKS PERFORM WALKING FORWARD?
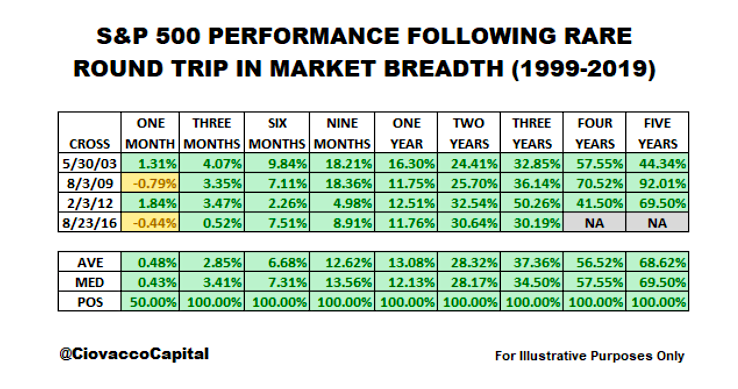
Rather than waiting for something to happen (i.e. market to make a top), the table below is based on something that just happened. In the previous cases, and based on all the data available, subsequent S&P 500 performance was very satisfying looking out three months to five years.

Continuing with the weight of the evidence theme, ten new signals and S&P 500 performance tables are covered in the video below.
DOES THE BLOW-OFF TOP THEORY HOLD WATER?
The hot topic on Wall Street this week was “blow-off top”. How concerned should we be about an end to a euphoric stock market rally? You can decide.
REALISTIC EXPECTATIONS
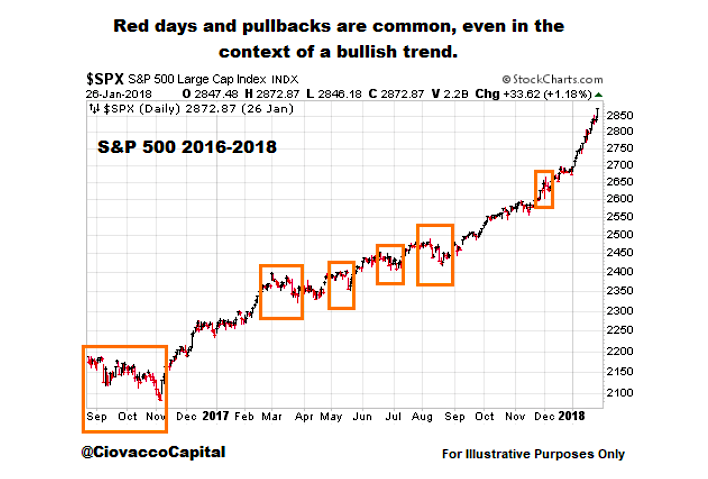
Was it a cake walk after the breadth thrust round trip that was triggered on August 23, 2016? No, reminding us that even under a longer-term bullish scenario, really scary periods are to be expected.

PREVIOUS SIGNALS ALIGN WITH SIGNALS ABOVE
The Seeking Alpha posts below provide additional support for the longer-term bullish case:
Financial Conditions: Today vs. 1974, 1987, 2000 And 2007
Are Financials Hinting At 2011/2016-Like Stock Market Rally?
Extremely Rare Extended Condition In Bonds: What Could It Mean For Stocks
DAY BY DAY
We will continue to test the cyclical low (December 2018) in the context of a secular trend thesis in upcoming posts and videos. If the weight of the evidence begins to shift in a bearish manner, we must be willing to adjust our assessment of the probabilities.
Twitter: @CiovaccoCapital
The author or his clients may hold positions in mentioned securities at the time of publication. Any opinions expressed herein are solely those of the author, and do not in any way represent the views or opinions of any other person or entity.


