The most recent bitcoin rumor hot off the press is that the US Securities and Exchange Commission (SEC) may create a national $BTC reserve.
This has bulls hoping that this will trigger another bull run.
And it might.
But the price for now tells a different story, hence, we expect that narrative to change accordingly.
From a strategic perspective, the US having bitcoin as a reserve currency would most likely lead to a US dominance.
There is a new project called BTC Bull, which launched its presale last week with promises of big $BTC rewards for those who bet on $BTC’s future.
Basically, the project will give away free BTC airdrops to token holders when Bitcoin reaches 150k and then at 200k and so on.
Since the presale began, the project has raised $2 million.
Furthermore, Texas and over 15 U.S. states, including Ohio, Kentucky, Pennsylvania, and Georgia, are also considering investing in Bitcoin.
While this trend is commendable, some analysts believe a state-level Bitcoin reserve may not impact BTC’s price.
And that brings me back to price and the narrative.
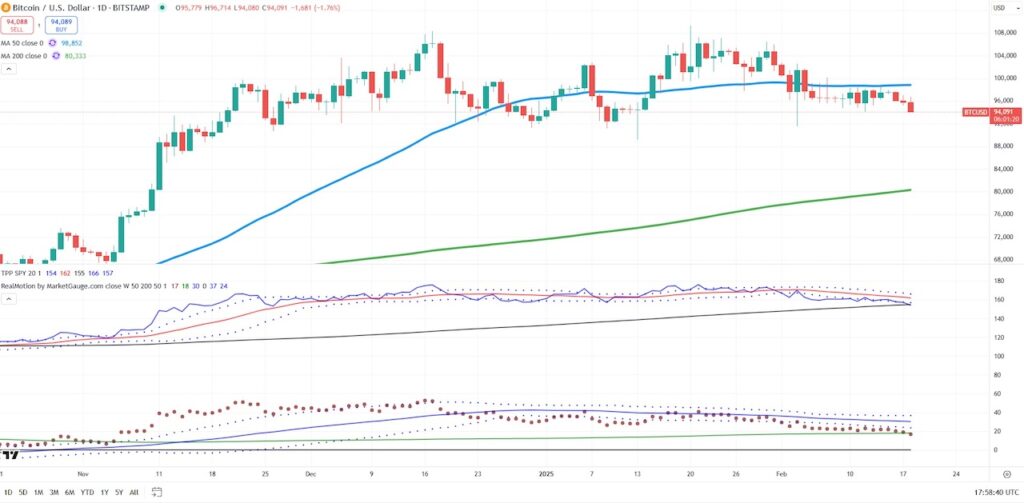
On the Daily chart, with all the attention and headlines, Bitcoin fell to new multi-week lows.
January 13th the low was 89,164.
With Bitcoin currently in a warning or caution phase, trading under its 50-day moving average, it is possible the sell-off reverses before hitting that January low.
On the Daily chart, Bitcoin is underperforming the benchmark.
Furthermore, the momentum indicator tells us that the bearish divergence between price and momentum is steepening.
Note how the red dots are now below the 200-DMA (green) while the price remains above.
Should Bitcoin break down under 89k, we refer to the weekly chart.
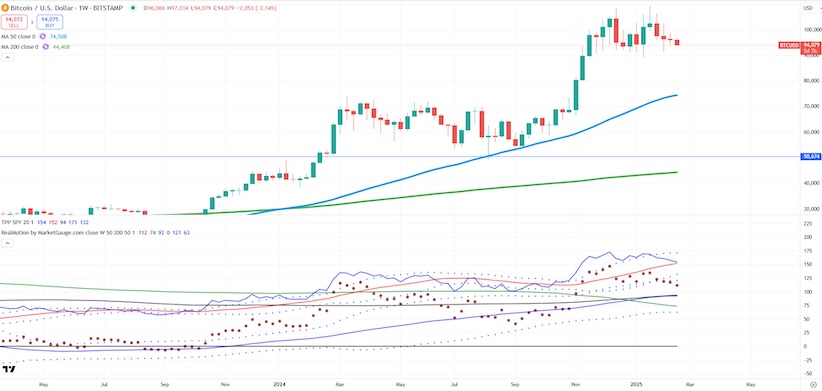
I love the weekly charts as they help us look out a bit and get a broader perspective.
First, you can see that BTCUSD is far from its major support at the 50-week moving average at about $75k.
While BTC continues to perform on par with the SPY, the real motion indicator shows that the momentum is declining and has a way to go before it is in oversold territory.
As the price declines, the idea is to find a support level to buy with the best risk if wrong.
For now, we are standing aside until PRICE tells us what’s next.
Twitter: @marketminute
The author may have a position in mentioned securities at the time of publication. Any opinions expressed herein are solely those of the author and do not represent the views or opinions of any other person or entity.
 and Semiconductors (SMH)")
")
 Make A Higher Low?")


 Make A Higher Low?")