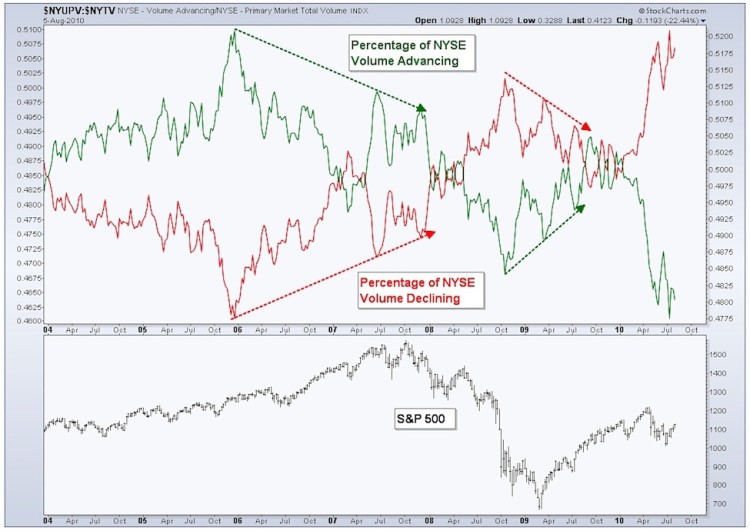
Starting in 2006 we began to see a trend change in both volume that was advancing and volume that was declining as a percentage of total NYSE volume. It took over a year for the shift in stock market volume to begin to be reflected in price, a good reminder that if the change that may be taking place currently is correct it doesn’t necessarily mean price will turn on a dime and head lower.
Also notice the trend changes in volume before the 2009 low. Starting in October of 2008 a series of higher lows (for volume advancing) and lower highs (for volume declining) began to take place – signaling a shift in market buying and selling pressure.
Pairing this type of volume analysis with the long-term trend and moving average breaks that’s taken place in major U.S. indices, and the deterioration in other market breadth indicators is concerning. At the end of the day, price is what’s important and is what we must keep our focus on. Storm clouds may be setting in, but we don’t begin to use umbrellas until it starts to rain.
Thanks for reading.
The information contained in this article should not be construed as investment advice, research, or an offer to buy or sell securities. Everything written here is meant for educational and entertainment purposes only. I or my affiliates may hold positions in securities mentioned.
Twitter: @AndrewThrasher
Read more from Andrew on his Blog.
Any opinions expressed herein are solely those of the author, and do not in any way represent the views or opinions of any other person or entity.


