Financial markets, including bond, equity and commodities, can be very fickle.
Sometimes there is bad news and a bull market just shrugs it off. But there are times when bad news has a much more dramatic impact on asset prices, bear or bull market.
The differentiating factor is often the confidence of the market, i.e., how resilient it is.
It would be fair to say that at the beginning of January, the market was very confident, so much so that the rising geopolitical tension between the U.S. and Iran was almost a non-event from the market’s perspective.
We are not downplaying the longer-term implications of rising tensions between these two powers, but this bull market absorbed the news quickly and resumed its upward trend.
At the moment, with the rising news of the coronavirus in the final weeks of January, that confidence appears to have been sapped.
With that said, let’s look at the latest news regarding coronavirus and follow that up with a bull market cycle update for investors.
Coronavirus

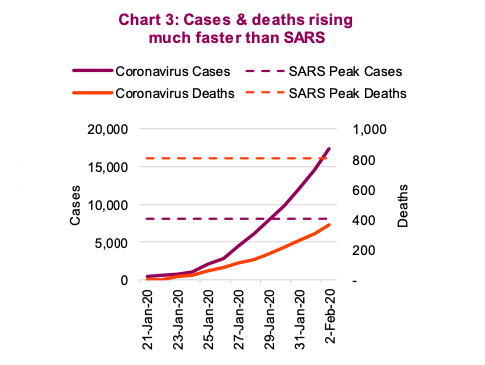
As of February 3, there are a little over 350 deaths and 17,000 individuals infected by this virus. The first death has now occurred outside China – an individual in the Philippines who was a resident of Wuhan. The uncertainty remains very high as to the degree this pandemic will spread and how long it will take to become contained.
If you rely on SARS as a roadmap, the market reaction peaked alongside new cases. Clearly, these cases are still rising quickly and have already surpassed the global SARS tally of a little over 8,000. However, comparing the absolute numbers may be misleading as society has become more efficient in diagnosing disease and the SARS outbreak was masked in more unknowns. (Chart 3).
Still, with cases rising, so too are the risks. The next shoe to drop that could weigh on markets would be a second epicenter of human-to-human transmissions. While it may change, the death rate in those affected remains materially lower than SARS (10-15% versus 2-3%). But it’s possible these numbers will likely rise given the data is still early.
We continue to believe that attempting to draw comparisons with SARS or the market impact of other health issues is likely more misleading than insightful – a case of apples and oranges! SARS hit when markets were near the tail end of a 2+ year bear market, with the S&P 500 already down 23% in 2002. In contrast, the S&P rose 29% in 2019. Plus, the sample size of one doesn’t instil confidence when it comes to making any comparisons. We do know, however, that regardless of the source of the issue, markets hate uncertainty, and this skittishness has dramatically elevated.
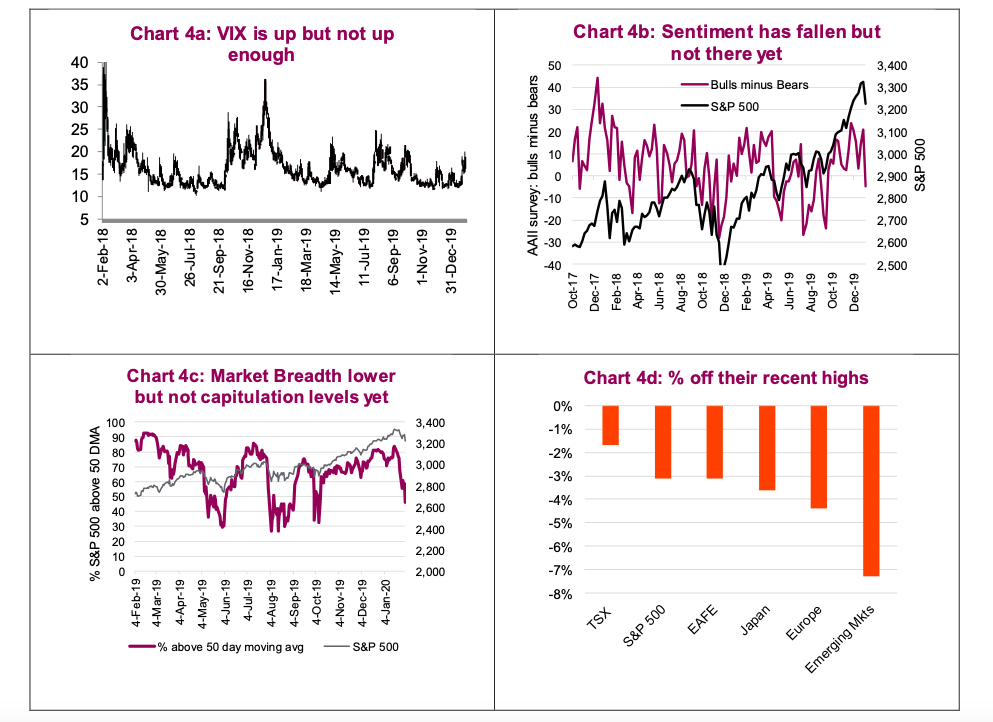
The next few weeks will likely be very volatile. At this point we have not witnessed enough of a pullback to get us too excited about a potential opportunity. In the charts below we have updated a few of our market correction watch indicators that can be reliable in finding capitulation points for the market in general. To date, none are there yet.

The VIX is up but remains below 20. Investor sentiment, a survey released on Thursday, took a hit but has not reached capitulation levels. Interestingly, ETF flows in equities globally were still positive last week. Market breadth has dropped but corrections often see this down to 25-30%. And of course, then there is the amount of drop in the indices. TSX is doing well, thanks to gold. Emerging markets, not surprisingly, are being hit the hardest.
Market Cycle – Old and a bit less healthy

Historically, these recent health outbreaks have not had a material impact on the global economy. The region where the outbreak first occurred is hard hit, but so far this hasn’t escalated to the global economy. SARS was estimated as having a 0.1-0.2% impact on global GDP (remember, this comparison is risky). Ebola was similar in having a minimal impact on global GDP. Nonetheless, during a time when investors are increasingly concerned about slowing global growth, this isn’t good economic timing (not that there is ever a good time for something like this).

Add to this the fact that Q1 is typically a soft quarter, plus the return of an inverted yield curve, it is a safe bet you will see recession talk become more prevalent in the coming months.
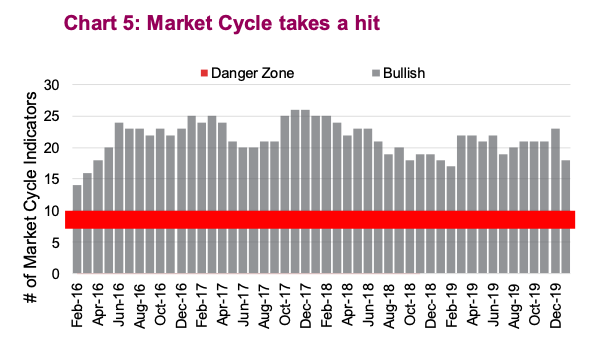
This uncertainty, plus soft data, plus yield curve inversion has translated into our Market Cycle indicators dropping. From the end of December we have seen the number of positive indicators drop from 22 to 18 (Chart 5). They are still well above the danger zone, but the drop is rather sudden, so lets dig into the data.
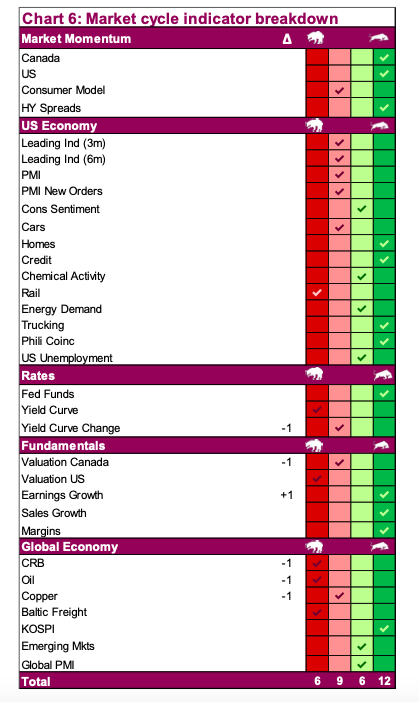
The good news first: U.S. economic data improved during the month. While there wasn’t a change in the number of bullish signals, there are now fewer strongly bearish ones (only rail volumes) and the number of strongly bullish signals rose.
Rates were a negative contributor. The yield curve remained bearish as we use a higher threshold than simply an inverted curve. For this to be bullish it needs some steepness in the yield curve. The yield curve change did drop into the bearish camp as the curve flattened and then inverted with the 10-year yield falling. Fundamentals were a wash.
The big soft spot, not surprisingly, was global economic indicators. A number of these are commodity sensitive and commodities have been falling fast. The others are holding in, but could flip should we see more weakness in emerging market equity prices.
Source: All charts are sourced to Bloomberg L.P. and Richardson GMP unless otherwise stated.
Twitter: @ConnectedWealth
Any opinions expressed herein are solely those of the authors, and do not in any way represent the views or opinions of any other person or entity.


