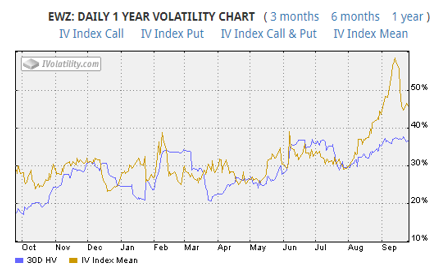
When implied volatility on the Brazil ETF (NYSEARCA: EWZ) went through the roof earlier in the month, I took notice.
Having previously hovered around the 25-30% mark for most of the year, the spike to nearly 60% was huge.
Sure, the ETF had experienced a rough run and Brazil is renowned for political turmoil, but 60% implied volatility and juicy option premiums were too tempting to pass up.
EWZ Volatility Chart
I was actually a little early on the trade, entering on August 29, when IV was at 48%, but the trade still worked out well.
Date: August 29, 2018
ETF Price: $32.91
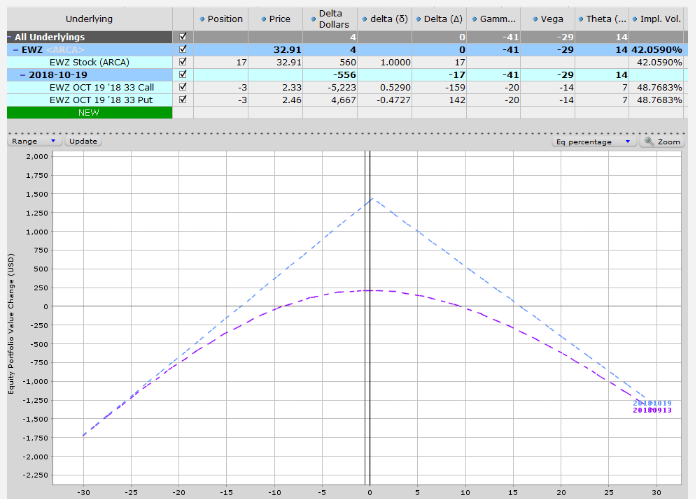
Trade Details: EWZ Short Straddle with Delta Hedge
Sell 3 EWZ Oct 19th $33 calls @ $2.33
Sell 2 EWZ Oct 19th $33 calls @ $2.46
Premium: $1,437 Net Credit
Buy 17 shares at $32.91 = -$559.47
Here is the initial risk graph:
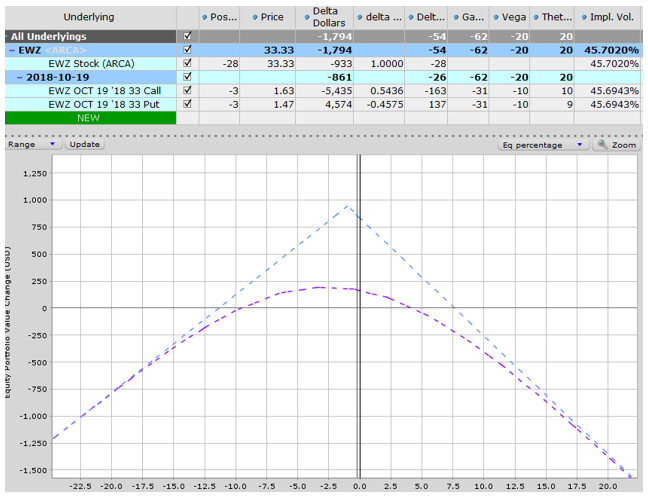
By September 5, EWZ had declined and the positive had positive delta of 65, so I sold 65 shares at $31.18 to get back to delta neutral.
On September 19th I bought 20 shares at $32.52.
As of September 25, the trade is sitting at +$391 with the Straddle declining from $1,437 to $930 while I’ve made a loss of $116 on the shares used in the delta hedging.
I’ll be looking to exit the trade soon, perhaps if it gets to +$500.
The video below explains the process if you would like to see another example. I really like using this strategy when I see a stock or ETF with really high implied volatility compared to the previous 12 months.
VIDEO
Twitter: @OptiontradinIQ
The author does not have a position in mentioned securities at the time of publication. Any opinions expressed herein are solely those of the author, and do not in any way represent the views or opinions of any other person or entity.


