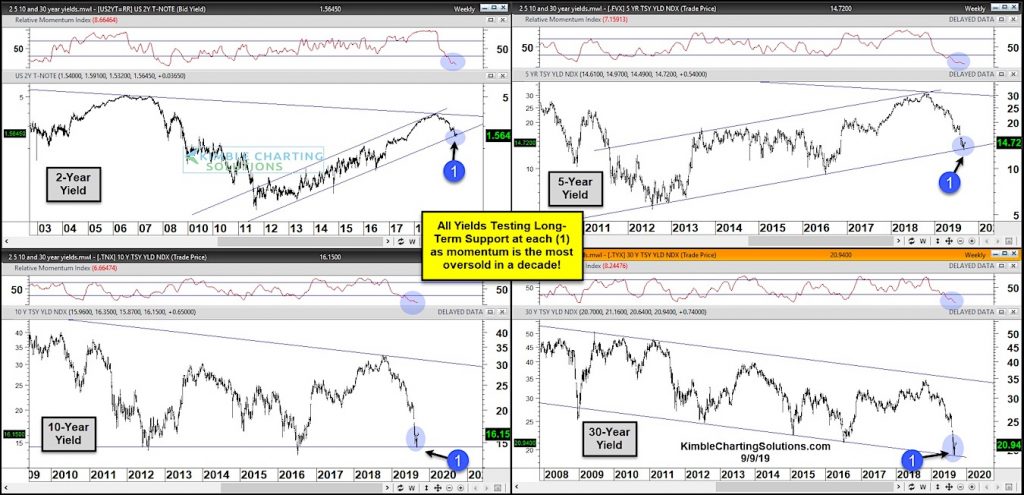
U.S. Treasury Bond Yields – 2, 5, 10, 30 Year Durations
The past year has seen treasury bond yields decline sharply, yet in an orderly fashion.
This has spurred recession concerns for much of 2019. Needless to say, it’s a confusing time for investors.
In today’s chart of the day, we look at a longer-term view of the 2, 5, 10, and 30 year treasury bond yields.
Short to long term bond yields are all testing 7 to 10-year support levels as momentum is at the lowest levels in a decade.
A yield rally is likely due across the board after a recent decline that was bigger than the stock crash in 1987!
That said, keep an eye on those support levels!
Note that KimbleCharting is offering a 2 week Free trial to See It Market readers. Just send me an email to services@kimblechartingsolutions.com for details to get set up.
Twitter: @KimbleCharting
Any opinions expressed herein are solely those of the author, and do not in any way represent the views or opinions of any other person or entity.


