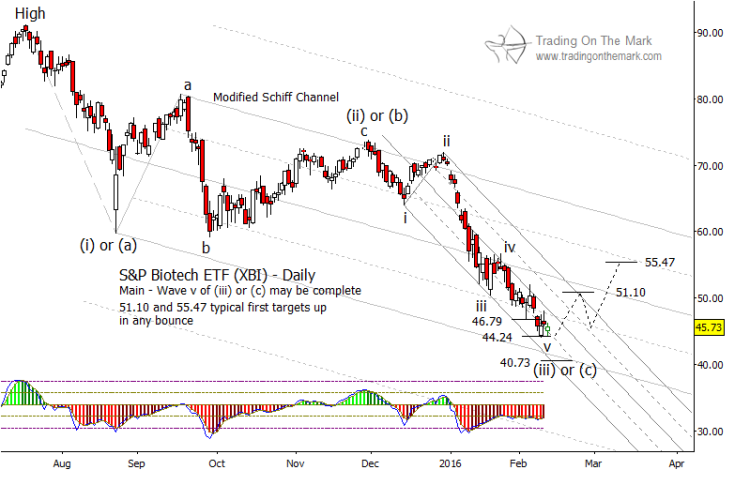
Over two weeks ago, we shared our thoughts on why the S&P Biotech Sector ETF (symbol XBI) might be nearing a tradable bottom. In that post, we suggested that the biotech sector ETF and select biotech stocks may be searching for support to rally from (countertrend).
Now it appears that the downward wave count for the Biotech Sector ETF (XBI) could be complete, and price has reached an important support area for a tradable bottom.
The chart below offers a quick update, holding promise for perhaps a short-term trade in biotech stocks.
Watch for a bounce in XBI to begin near the present area of 44.24, although price could reach a bit lower – perhaps to the area near 40.73 – if there is another down draft in the stock markets during the next one or two weeks. But if all signs of a countertrend rally are confirmed, then the Biotech Sector ETF may be headed back up into the 50’s.
Biotech Sector ETF (XBI) Stock Chart
We do not yet know the magnitude of the expected bounce. If the present lows hold, then standard retracement values measured from that low would be in the vicinity of 51.10 and 55.47. One or both of those areas could provide resistance for the sector ETF (and provide a gauge for select Biotech stocks), and it would probably make sense for long traders to start scaling out of positions near those levels.
If price ventures much lower than 40.73, then we would need to reconsider our Elliott wave count of the decline from last summer’s price high.
Keep up with this and other markets by following us on Twitter and asking to receive our newsletter!
Further Reading: “Crude Oil Prices At New Lows: Is Opportunity Knocking?“
Twitter: @TradingOnMark
No position in any of the mentioned securities at the time of publication. Any opinions expressed herein are solely those of the author, and do not in any way represent the views or opinions of any other person or entity.


