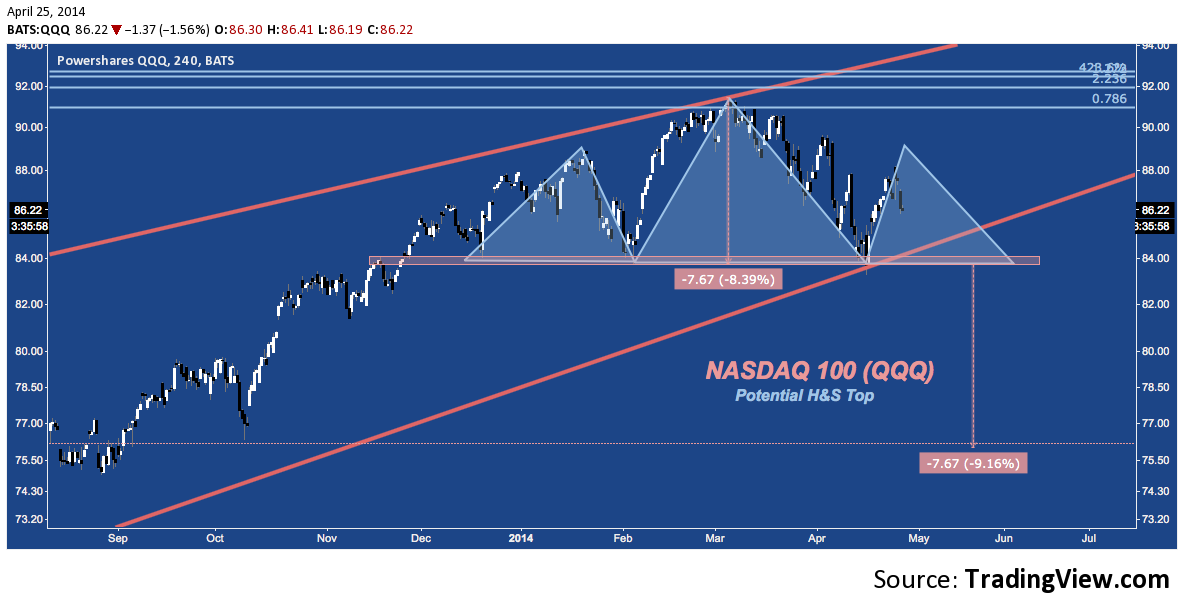
The NASDAQ 100 continues to build out a medium-term Head & Shoulders Top pattern that began developing during December 2013’s Santa Claus rally. Aside from noting the dark irony of how that stupefyingly bullish phenomenon has been appropriated by a much larger bearish pattern, know from the start the H&S Top remains a potential pattern only, albeit with a clean neckline at $84 below which it activates (on QQQ). For a great tear-down of the relevant levels and some balanced commentary on the pattern’s prospects, check out the analysis by Market Master JC Parets over on All Star Charts.
Now, consider the pattern under discussion:
How this construction plays out will be of major importance: not as an end in itself – though a decline to $76 is a huge downside in the present market context – but especially as the activation trigger that “turns on” a much larger pattern – one receiving comparatively little attention.
That pattern? The 5-year Rising Wedge mounting since QQQ‘s December 2008 lows:
Understanding the full implications and potential of this H&S Top can’t be accomplished by analyzing it’s structure alone. In a wider context, this pattern is developing as a sustained, serialized rejection of structured fibonacci resistance (the horizontal blue lines at the top of both charts) that has plotted between $91-$93 for years. Complementing this, a break below $84 is not simply an H&S Top trigger, but would represent the first major violation of rising trend line support that has almost effortlessly held throughout 2012 and 2013.
The H&S Top could even act as a catalyst for momentum generation that heightens the likelihood of a bearish resolution of the wedge. The technical implications of that pattern are truly (if still potentially) immense, with the first real rung of horizontal support near $69 – an additional -10% below the H&S Top target – and then at $60 and finally major support (see points X and B) between $55-$60.
Before running to the fallout shelter triggered by hints of a -30% drop; remember: as a much larger pattern required to reach its targets is likely to be much longer; and as a result the pattern is more susceptible to failure.
Still, it pays to understand what’s on the table and the more dire basic scenario that becomes increasingly plausible where and when this H&S Top plays out. As JC points out: “In general, I don’t think it’s advantageous to search for patterns like this. But when they appear and confirm, they can provide some extremely violent moves.”
In this scenario, confirmation of one pattern begets confirmation of another; and alludes to a move that could ultimately be even more violent than QQQ‘s H&S Top suggests.
Twitter: @andrewunknown and @seeitmarket
Author holds no position in securities mentioned at the time of publication. Commentary provided is for educational purposes only and in no way constitutes trading or investment advice.
Any opinions expressed herein are solely those of the author, and do not in any way represent the views or opinions of any other person or entity.


