 By Alex Bernal
Listening to a half a dozen “Giants of Investing” at a conference recently I could hardly hold back my scoff when one very notable money manager pointed out that according to the current comparatives of the P/E on the S&P 500, “it’s cheap relative to everything, it’s the only market that hasn’t really rose to new heights.” He then went on to state the following when asked about current valuation, he replied that “it is really, really interesting. I hate to say how cheap it is.”
This is where I almost fell out of my seat. I thought out of what fantasy land could these fundamental experts and valuation driven money managers come to this bonkers conclusion, stocks are cheap!?
Granted I will admit I am somewhat of a purist technical analyst and don’t peak my head over the fence into fundamentals all that often, but given this particular topic, I couldn’t resist laying out my two cents. My first notion is that there are probably many new and complex fundamental models that are invented every day measuring every bit of accounting information available that I probably don’t know about. Coupled with sustained negative real interest rates & the recent changes in Mark to Myth accounting standards, this could have skewed fundamental valuations off into lala land in ways I might not fully understand. I still think the following focus charts are three very important fundamental bear market valuations and conditions that are reached when major bear markets end.
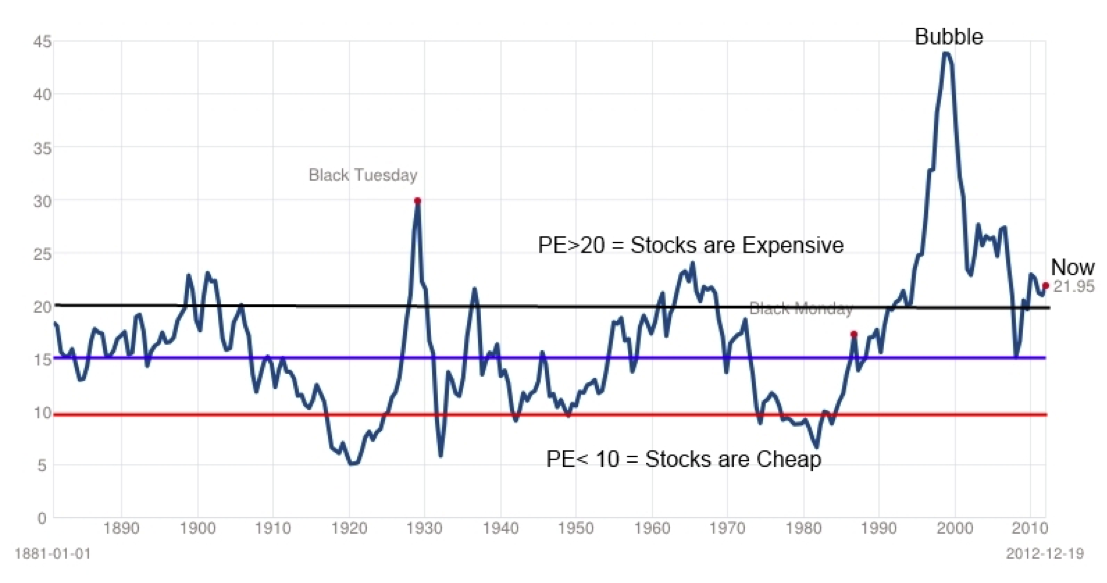
Condition 1: S&P 500 P/E at or below 10
At the bottom of all prior major bear markets (1922, 1933, 1950 & 1983) the P/E ratio dropped to a range of 5 to 10. Granted there were other minor bear markets that occurred in between where valuations did not become this cheap but at the end of major debt cycles one would think they should. Like the one we are currently in, the natural deflationary forces flush out previous excess credit & malinvestments to the point where real values catch up with reality. At the crash low in 2009 the S&P 500 P/E reached 13 at its lowest point and rose to 23 in mid-2011. This is the first indication to me there is still far too much generational enthusiasm and insatiable thirst for speculation in stocks to even consider the notion that stocks are “cheap.” It could even be argued that the lowest bear market valuation we saw in 2009 was a bounce of levels that were higher than many previous bull markets! I believe that the most likely scenario is when we do finally reach the bottom of this current major bear market cycle investors will be completely despondent, no one will have any interest whatsoever in the stock market, and working in finance will be considered a poor life decision by most parents. Stocks will then be on sale at extremely fire sale low P/E multiples at levels congruent to that of normal stasticially historic measurements of previous bear market bottoms. Click chart to Enlarge.
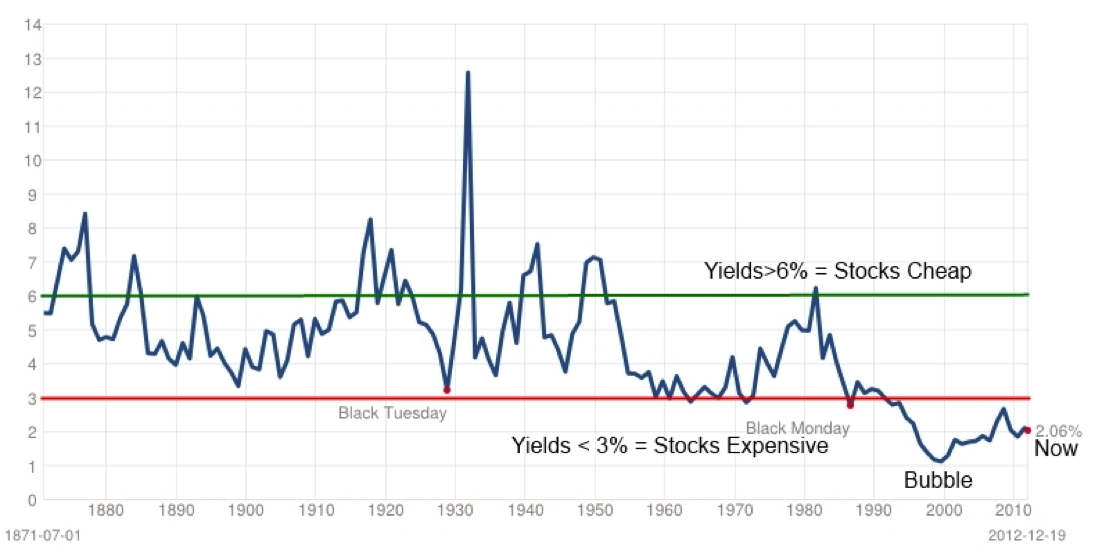
Condition 2: Dividend Ratio at or below 10
The next classical measure of value is dividend yield, this measures real cash flow that companies pay their shareholders for owning their stock. True value investors know that when they buy shares in a company, they are buying its dividends, which generate cash flow. We can pay too much or very little for those dividends depending on where we are in the market cycle. If we buy shares when the market price is high and the dividend yield is low it may be that investors are too enthusiastic and are paying too much. When we buy shares when the dividend yield is high and investors are despondent, we can buy great values and get dividends on the cheap.
There’s still a desperate linger of speculation disguised as “investment,” though. Too often do I talk to people about buying stocks and their first and most often notion is that they want the stock to rise. I then have to try and explain that the stock could be priced at $5.00 and falling because the company MAKES NO MONEY & HAS NO DIVIDENDS.
Granted I will admit that the data shows the overall trend or skew of yields has been lower over time since companies have started using other tools to create returns for shareholders, like share buybacks, options or convertibles. I have also noted that the total return including reinvested dividends during the 1982 – 2000 bull market was as high as or higher than prior bull markets. And it may be that we have not seen the dividend yield increases that we have seen in prior bear markets due to the same phenomenon.
However I have been witnessing an increasing appetite for dividend paying stocks and funds as it seems investors are slowly starting to realize that long-term equity returns have historically been generated via dividend reinvestments, not just nominal price increases. I would expect that dividend yield on the s&p 500 will reach at least 5% before this bear market is finally over. Click chart to enlarge.
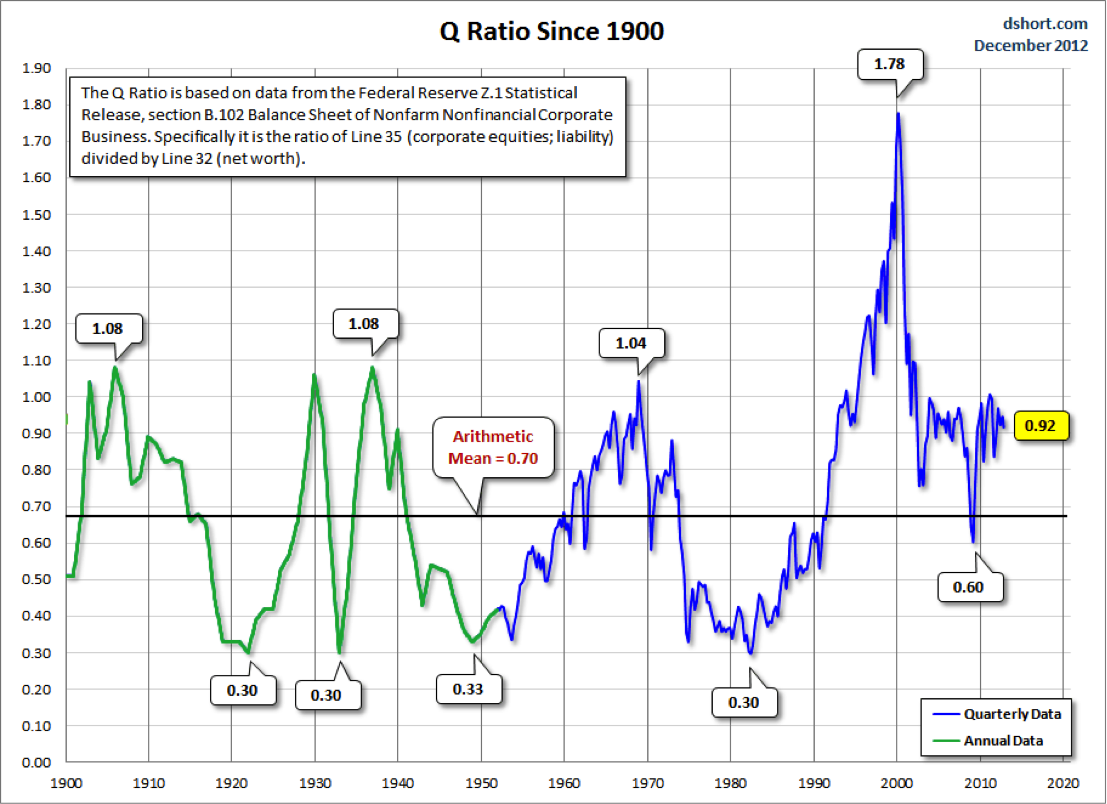
Condition 3: Tobin Q Ratio at or below 0.40
The last valuation measure I want to showcase is the Tobin Q ratio. The Q ratio is a company’s market value (determined by financial markets) divided by its book value (published in financial statements). The Q ratio for the broad market can be calculated using data published by the Federal Reserve called the Flow of Funds Accounts. When the gauge is more than one, it indicates the market is overvaluing company assets, while a Q ratio of less than 0.50 signifies shares are undervalued because it is cheaper to buy companies than to build them from the ground up. At the end of the four largest U.S. bear markets in 1921, 1932, 1949 and 1982, the Q ratio fell to 0.3 or lower. Currently the market is over-valued again based on Tobins Q with a reading of 0.92. It can be reverse calculated that the S&P 500 would have to fall 34% or 45% to be fairly valued from its current levels. Again, this signals that major bear market valuations may not have been met. Click chart to enlarge.
SOURCE: Picture from Dshort.com
The Hyperinflation Scenario – Floating on an Endless see of Fiat Paper.
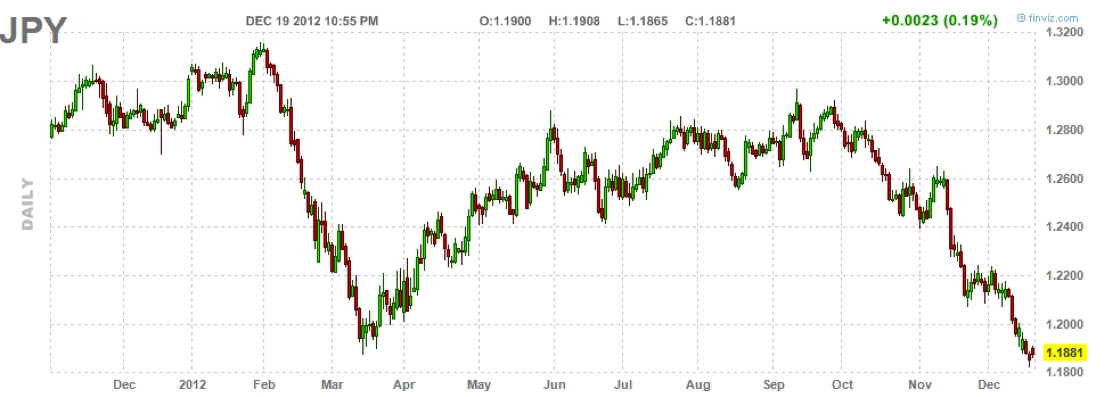
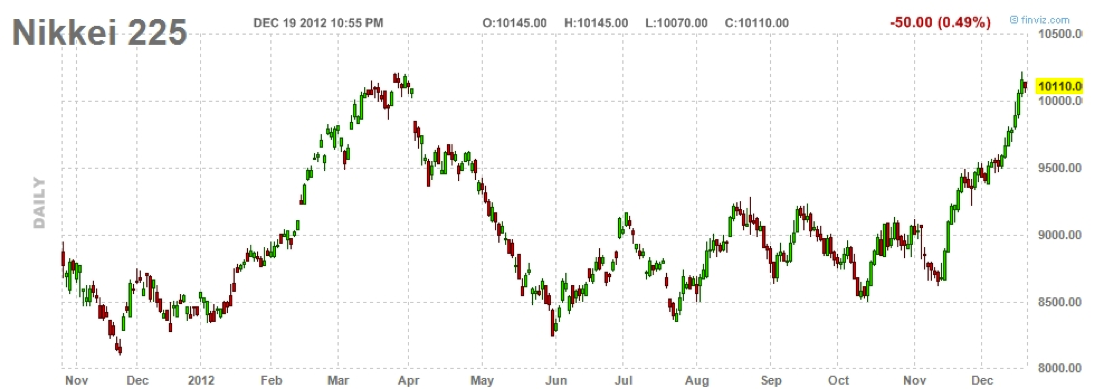
The only other alternative scenario that I give credence to is the Invisible Crash Scenario. This is a far more dangerous situation, where the nominal value of our stock market will sky rocket to astronomical heights as the value of the denominating currency crashes. Previous case studies such as the Mexican peso hyperinflation of 1990 -1993 saw a nominal appreciation of there stock market to the tune of something like 2000%+. Additionally one could also liken the current movements of the Yen and Nikkei to this same scenario. A flight to “tangible” assets in the form of ownership of Japanese stocks over falling yen. Click charts to enlarge.
One thing is for sure even in the hyperinflationary scenario it will be near impossible to value whether stocks are cheap or expensive because the value, as measured by the underlying currency will be nonexistent. Either way it is in my humble opinion that by the classic and simplest standards of intrinsic valuation I don’t think stocks are, or ever got to the point, where they could be labeled as cheap. Does that make me a super bear! No, markets have proven that they can remain irrational for very long periods of time. Negative real interest rates & the flood of fiat being the key driving forces herding the masses into stocks for one last hurrah. Meanwhile, Few in the world seem to grasp that we are possibly headed towards a paper-currency debacle of biblical proportions.
Disclaimer: This in no way constitutes investing advice. All of these opinions are my own and I am simply sharing them. I am not trying to convince anybody to do anything with their money. I am simply offering up ideas for the sake of discussion. As always, everybody is expected to do their own due diligence and to ultimately be comfortable with their own investing decisions. Any actions taken based on the views expressed in this blog are solely the responsibility of the user. In no event will Aether Analytics or its owner be liable for any decision made or action taken by you based upon the information and/or opinion provided in this blog.
Twitter: @InterestRateArb and @seeitmarket
No positions in any of the mentioned securities at the time of publication.

