Bank Index to S&P 500 Ratio Performance Chart
Banks continue to underperform the broad markets.
And this could become a problem for stock market bulls soon.
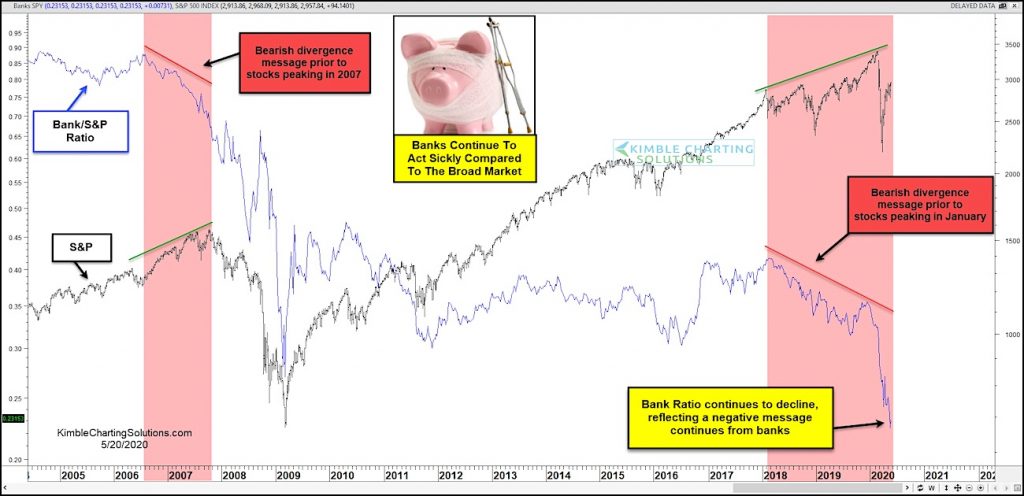
In today’s chart, we look at the ratio of the Bank Index to the S&P 500 Index. As you can see, there was a major divergence before the Financial Crisis in ’07-’08 as well as before the coronavirus crash this year.
The concern this year is that banks continue to act sickly compared to the broad market.
The Banks to S&P 500 ratio continues to head lower, reflecting a negative message from banks… and one that may take the broader market lower again soon. Stay tuned!
Note that KimbleCharting is offering a 2 week Free trial to See It Market readers. Just send me an email to services@kimblechartingsolutions.com for details to get set up.
Twitter: @KimbleCharting
Any opinions expressed herein are solely those of the author, and do not in any way represent the views or opinions of any other person or entity.


