Our banking system is at the heart of our economy and an integral sector within the stock market. So the latest news about regional banks struggling has investors a bit shook up.
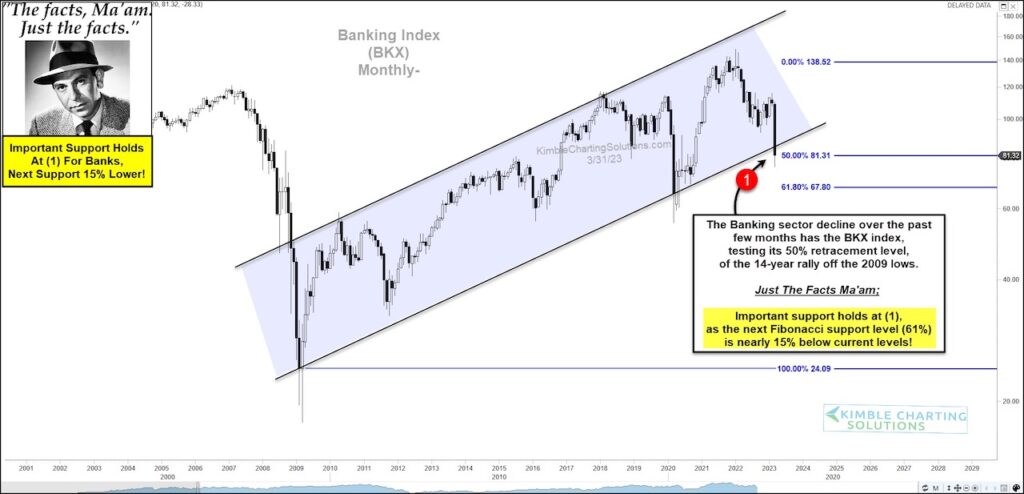
Today’s long-term “monthly” chart of the Banking Index (BKX) underscores investors latest round of uncertainty… and why bulls need to step up right here and now.
So we turn to Joe Friday and ask, “The facts, Ma’am. Just the facts.”
Looking at the chart, we can see that the Banking Index $BKX has been in a 14 year bullish rising trend. BUT that trend is at currently at risk. The latest selloff has $BKX testing dual support at its rising trend line and 50% Fibonacci retracement level since the financial crisis lows at (1).
Since it has technically pierced its rising channel, it is extra important that the 50% Fibonacci support holds and price rebounds quickly. If not, a deeper decline may come into play… and the next Fib level is nearly 15% lower. Stay tuned!!
$BKX Banking Index “monthly” Chart

Note that KimbleCharting is offering a 2 week Free trial to See It Market readers. Just send me an email to services@kimblechartingsolutions.com for details to get set up.
Twitter: @KimbleCharting
Any opinions expressed herein are solely those of the author, and do not in any way represent the views or opinions of any other person or entity.


