It’s September and the stock market is trading just below all-time highs. BUT, volatility has crept into the equity markets.
Uncertain economic data, questions about the Federal Reserve’s next move, domestic politics, and wars abroad are consuming investors.
SO, it is not surprising that bank stocks by be reaching a decision point.
“The facts, Ma’am. Just the facts.” – Joe Friday
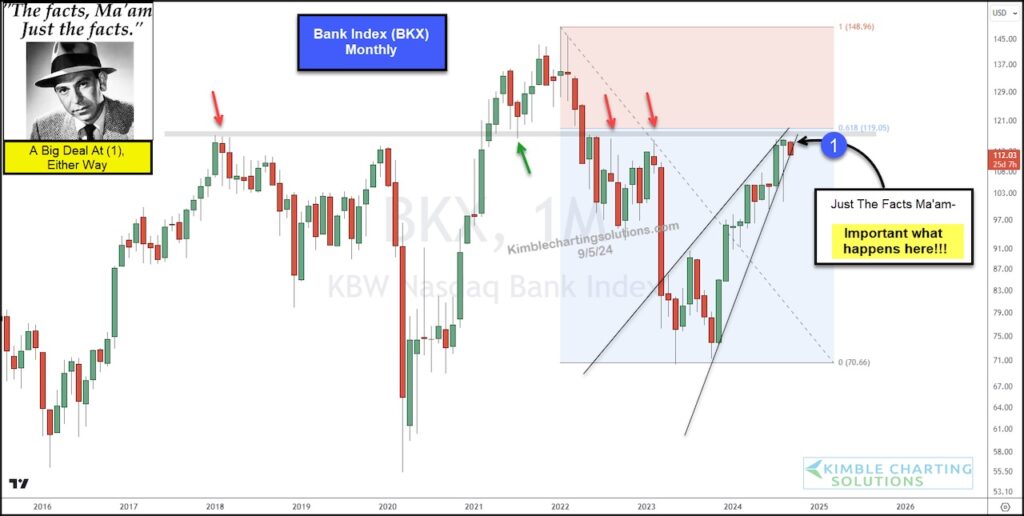
Today, we look at a long-term “monthly” chart of the Bank Index (BKX) to highlight its importance in determining the stock market’s next move.
As you can see, BKX is testing a historical support/resistance level following a multi-month rally at (1). At the same time, price has turned lower in early September and is currently testing support within a steep and narrowing rising wedge pattern.
I cannot help but think that what happens at (1) will be a BIG DEAL for banks and broad market! Bullish if it holds, bearish if it breaks. Stay tuned!
$BKX Bank Index “monthly” Chart
Note that KimbleCharting is offering a 2 week Free trial to See It Market readers. Just send me an email to services@kimblechartingsolutions.com for details to get set up.
Twitter: @KimbleCharting
The author may have a position in mentioned securities. Any opinions expressed herein are solely those of the author, and do not in any way represent the views or opinions of any other person or entity.


