After lagging for several months, bank stocks caught fire this winter. Since November, the Bank Index (BKX) has rallied 50 percent.
And bank stock bulls may be looking for more…
Will greed get the best of them or will the Bank Index soar to new highs?
To better understand and frame that question, we will look at the chart to investigate the current trading setup. And fortunately, this chart has a very clean setup with easily identifiable price points and risk levels.
Note that the following MarketSmith charts are built with Investors Business Daily’s product suite.
I am an Investors Business Daily (IBD) partner and promote the use of their products. The entire platform offers a good mix of technical and fundamental data and education.
$BKX Bank Index Chart
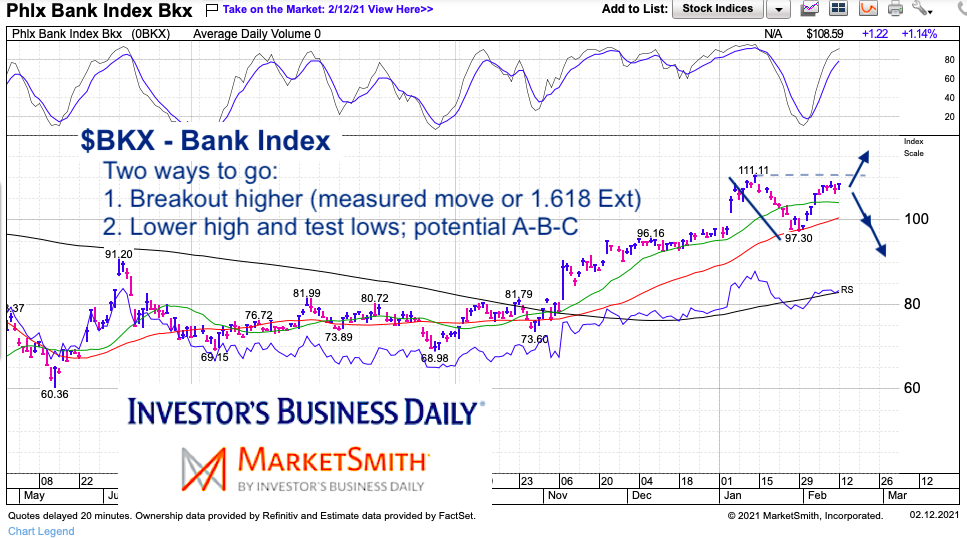
In early January, the Bank Index (BKX) gapped higher and rallied up as high as 111.11. That rally gave way to a pullback to test (and fill) the open gap before rallying once more. This is common price action (re-testing the breakout area).
BKX is currently in rally-mode and testing the January highs. Note that this price action has produced clearly defined price resistance (111.11) and price support (97.30). The bank index will either breakout over 111 or fall back towards support at 97.
A breakout to new highs would produce an initial 1.618 Fibonacci target of 119.64 and potentially a measured move target of 124.92. A failure to breakout would keep BKX in its current channel (111 to 97). Note that a lower high could also produce a move through support at 97 that could turn into an ABC move for a lower low. New money likely waiting for resolution or other bullish bearish indicators to develop.

Twitter: @andrewnyquist
The author may have a position in mentioned securities at the time of publication. Any opinions expressed herein are solely those of the author, and do not in any way represent the views or opinions of any other person or entity.


