The banks always play a major role in the performance of the broader stock market indexes.
On the bullish side of the ledger, the banking sector gives confidence to markets when it is outperforming or performing in line. On the bear side of the ledger, look no further than 2007/2008… or 2011 or 2015.
Today’s chart will will look at a popular Bank Index, the $BKX.
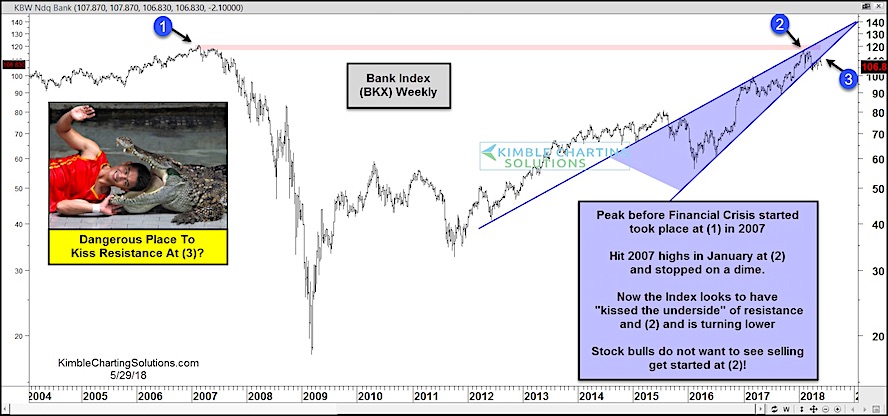
As you can see, the run higher in 2016-2017 saw big gains in the Bank Index which translated to big gains in the broader stock market.
But that run higher saw the Bank Index test its 2007 highs (see point 1 & 2)… that was the peak prior to the Financial Crisis. Note that the index stopped on a dime. So that marks important resistance for the BKX, as well as the broader bull market.
The concern right now is that the decline off those highs slipped through up-trend support within a rising wedge pattern. And the index is now kissing the underside of that trend line, which is now resistance (3).
Stock bulls do not want to see a wave of selling here!
Bank Index (BKX) – “Weekly” Chart
Note that KimbleCharting is offering a 30 day Free trial to See It Market readers. Just send me an email to services@kimblechartingsolutions.com for details to get set up.
Twitter: @KimbleCharting
Any opinions expressed herein are solely those of the author, and do not in any way represent the views or opinions of any other person or entity.


