The financial / banking sector is often a good barometer of the economy and broader stock market.
So when the Bank Index (BKX) began to lag late last summer, it was an early warning sign for investors.
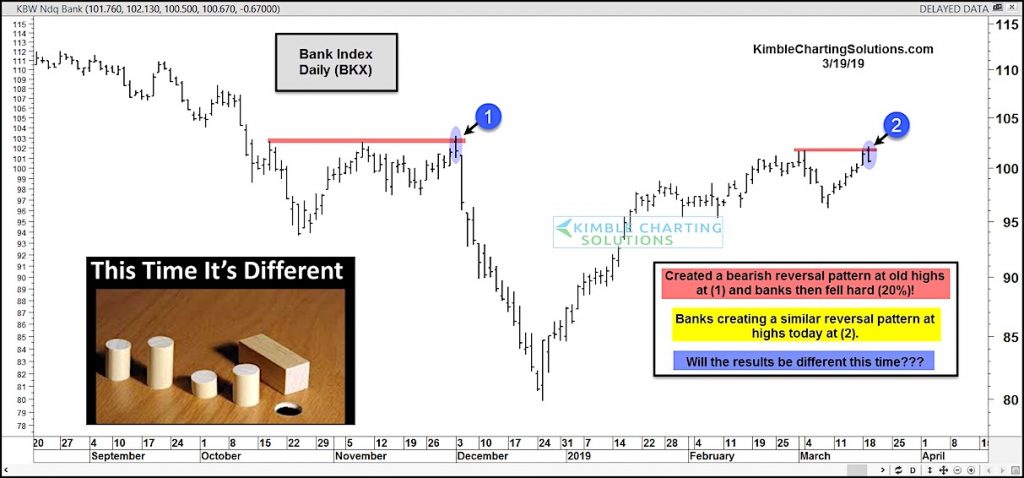
Looking at the chart below, we can see that the banks spilled lower with the December correction. That final swoon lower was set up by a bearish reversal candlestick (1).
Well, the recent rally has brought stocks back up to the scene of that crime! That area is marked by strong horizontal resistance.
Are banks creating a similar reversal pattern right now?
Check out Tuesday’s reversal candle at resistance (2). Will this time be different? Stay tuned!
Bank Index “daily”Chart

Note that KimbleCharting is offering a 2 week Free trial to See It Market readers. Just send me an email to services@kimblechartingsolutions.com for details to get set up.
Twitter: @KimbleCharting
Any opinions expressed herein are solely those of the author, and do not in any way represent the views or opinions of any other person or entity.


