Chinese web company Baidu (BIDU) reports 4th quarter earnings overnight. And it should be an important report for the company’s intermediate-term direction. According to Estimize, Wall Street is expecting EPS of 1.61 on revenue of 2.215 billion. Let’s take a look at how shares are trading into the BIDU earnings report.
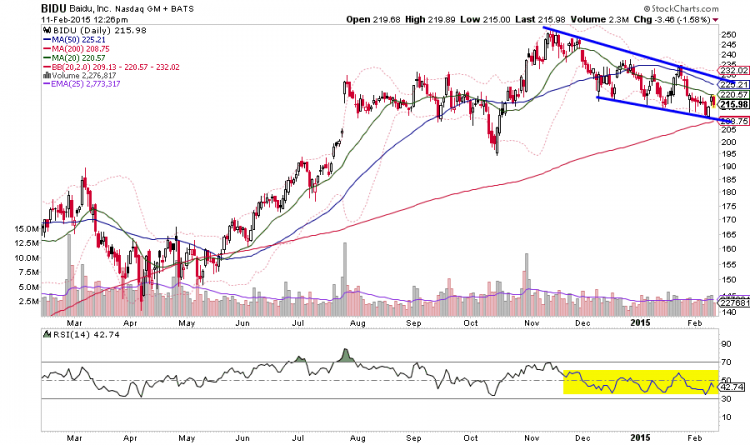
Looking at the stock chart heading into the BIDU earnings report, we see a falling channel with all of the shorter term moving averages sloping down. Yet, while the shorter term MA’s are falling, the 200 day moving average is rising (and sits just below the current stock price). This confluence of competing trends indicates that this earnings report may be important one for the stock price (and investors).
Note that shares haven’t touched the 200 day MA since last spring (which eventually saw a rally from $150 to $250).
Baidu (BIDU) Stock Chart – 1 Year
The options market is pricing in about a 13 point move. A 13 point upside move would send it right into a very thick resistance zone. A 13 point downside move would gap through the 200 day moving average (and falling support line) and likely bring a test of the October lows.
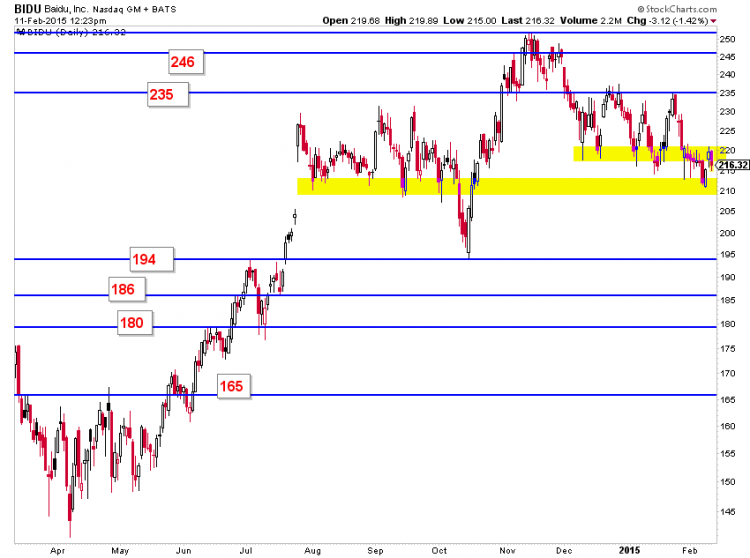
Here are some pivots outside of the recent range worth noting:
Another observation worth noting is this consternation in the 210-235 range over the past 6 months or so. Range breaks in both directions have failed and the market is just jammed up awaiting.
This is a real important earnings report for BIDU as short term trends are colliding with the long term trend. We’ll have to wait for the BIDU earnings report to see how it plays out!
Follow Aaron on Twitter: @ATMcharts
No positions in any mentioned securities at the time of publication. Any opinions expressed herein are solely those of the author, and do not in any way represent the views or opinions of any other person or entity.


