With the S&P 500 (NYSEARCA:SPY) and Nasdaq, and Dow Industrials making new highs once again, I thought it would good to review some key indicators and look across assets.
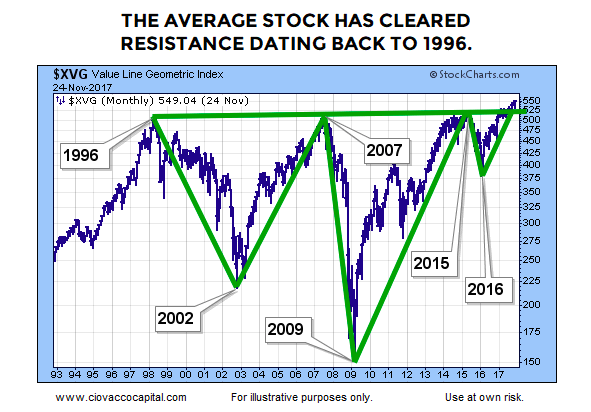
Today, I will go beyond the S&P 500 Index and look at the Value Line Geometric Index (INDEXNYSEGIS:VALUG). We will look at its long-term chart, along with its performance vs bonds and gold.
Average Stock Breakout
Since it is an equally-weighted and broad index, the Value Line Geometric Index is a good way to monitor the average stock. As shown in the chart below, a very long-term and bullish breakout occurred recently.
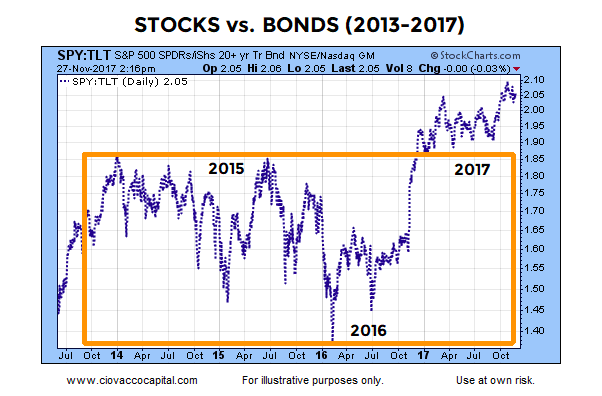
Stocks Break Out Versus Bonds
There is nothing in the stock/bond chart below that contradicts the bullish narrative told by the Value Line Geometric Index. The stock/bond ratio remains above an area that acted as resistance in 2015.
A Different Story From Longer-Term Charts?
This week’s stock market video reviews very long-term stock/bond and stock/gold charts to see what we can learn about the sustainability of bullish trends in the S&P 500. The video examines the odds of both bonds and gold providing disappointing returns relative to stocks in the coming 3 to 20 years.
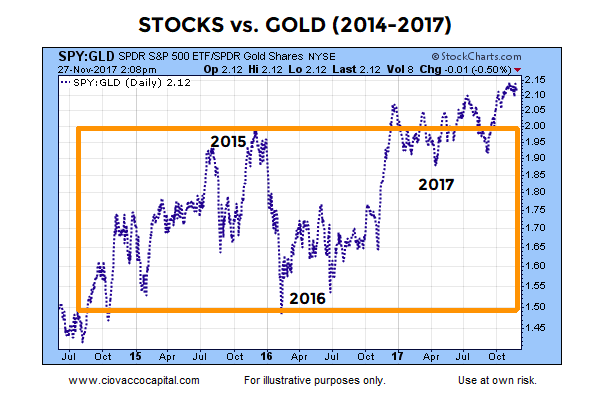
Stocks Break Out Versus Gold
There is nothing in the stock/gold chart below that contradicts the bullish narrative told by the Value Line Geometric Index. The stock/gold ratio remains above an area that acted as resistance in 2015.
Thanks for reading.
Twitter: @CiovaccoCapital
The author or his clients may hold positions in mentioned securities at the time of publication. Any opinions expressed herein are solely those of the author, and do not in any way represent the views or opinions of any other person or entity.


