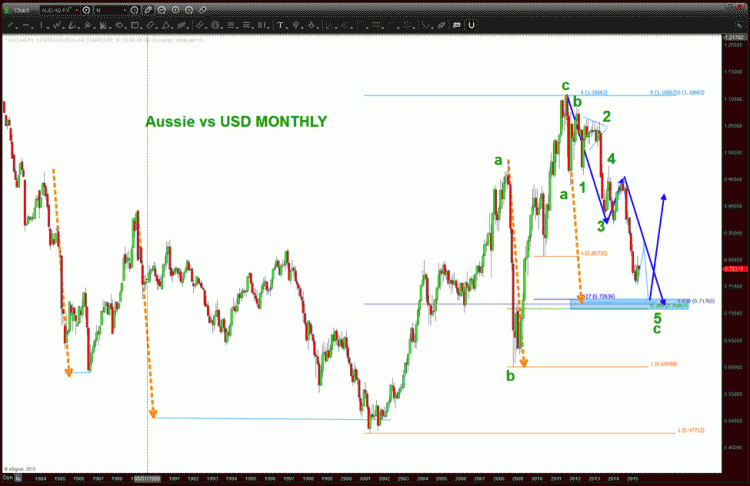
The Australian Dollar is putting together a nice rally for Forex traders. Also known as the Aussie and traded under the Forex pair AUDUSD, the Australian Dollar looks to be putting in a corrective rally before a final drop to its downside target. Although this may take several weeks to unfold, the pattern should offer opportunity for disciplined currency traders.
The AUDUSD briefly touched above .80 today and is currently trading around .798 as of this writing. And it may have room up to .85 or perhaps a little higher. In the chart below, I’ve put together a long-term monthly chart of the Australian Dollar. And, as one can see, the current wave patterns have come together nicely. Here’s a recap of what I am seeing here:
- The orange dashed line represents a measured move and is present at every major area of support.
- The current wave count shows one more wave up (in progress) which should be followed by another wave lower.
- We have multiple ratios coming together from two nodes of retracements, an extension and then the measured move AB=CD (see blue arrows going lower).
The blue arrow headed higher, represents what I believe will be a great opportunity to get long. But this will likely take several months to develop. For now, trade what’s in front of you. Have a great week and thanks for reading.
Australian Dollar “Aussie” – AUDUSD Chart
Also read my post on how commodity currencies like the Aussie correlate to select commodities like Gasoline.
Follow Bart on Twitter: @BartsCharts
No position in any of the mentioned securities at the time of publication. Any opinions expressed herein are solely those of the author, and do not in any way represent the views or opinions of any other person or entity.


