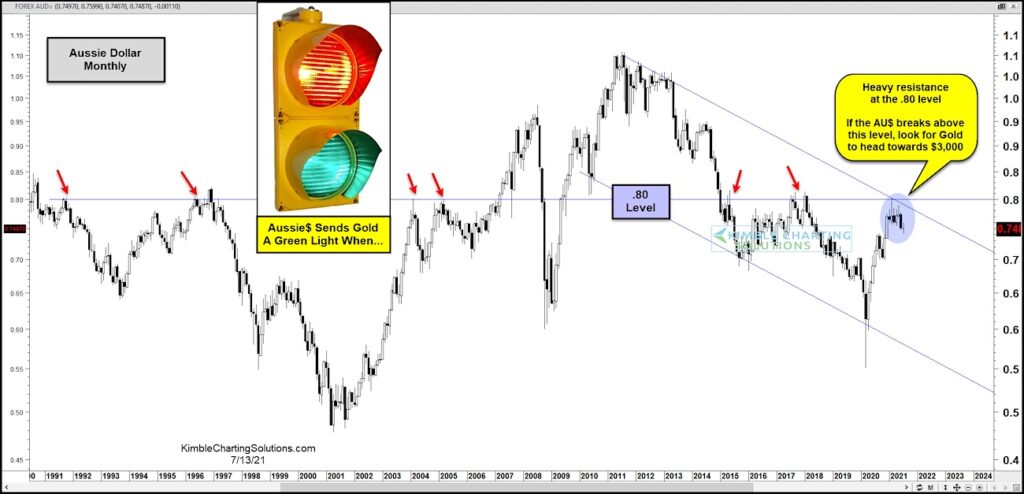
The Australian Dollar currency is trading near a very important resistance level.
And the implications are massive… especially for Gold and the precious metals complex.
Today’s chart looks at a long-term “monthly” chart of the Australian Dollar (“Aussie” Dollar). As you can see, the Aussie has been in a declining channel since peaking in 2011. Note Gold also peaked at that time (precious metals tend to perform well with a strong Aussie).
Looking at current trading, we can see that the Aussie is bumping up against massive resistance around the .80 level. This resistance is defined by a long-term horizontal support/resistance line, as well as the falling down-trend line.
A breakout higher would have big-time implications for the Gold… likely propelling it toward the $3,000 level. But wait for a clean breakout to signal a green light. Stay tuned!
Australian Dollar “Aussie” Currency Chart

Note that KimbleCharting is offering a 2 week Free trial to See It Market readers. Just send me an email to services@kimblechartingsolutions.com for details to get set up.
Twitter: @KimbleCharting
Any opinions expressed herein are solely those of the author, and do not in any way represent the views or opinions of any other person or entity.


