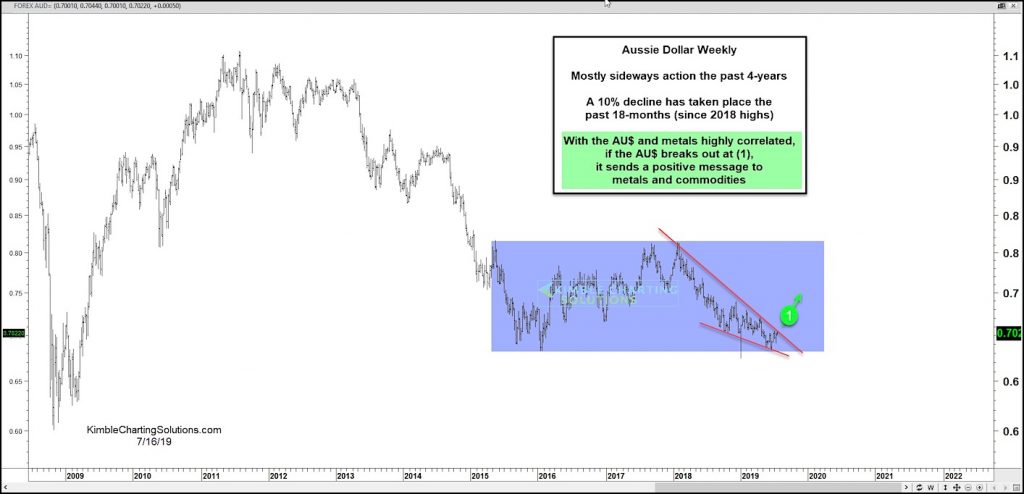
$AU Australian Dollar “weekly” Chart Image
The Australian Dollar and its ETF (NYSEARCA: FXA) have traded sideways for much of the past 4 years (see blue shaded area on chart above).
And since the Aussie Dollar and precious metals are highly correlated, this hasn’t helped gold and silver.
But this setup may be changing soon as a big test comes into play for the AU$.
It is currently testing falling resistance on a bullish falling wedge pattern.
If it succeeds in breaking out at (1), it will send metals and commodities a short-term bullish message. Stay tuned!
Note that KimbleCharting is offering a 2 week Free trial to See It Market readers. Just send me an email to services@kimblechartingsolutions.com for details to get set up.
Twitter: @KimbleCharting
Any opinions expressed herein are solely those of the author, and do not in any way represent the views or opinions of any other person or entity.


